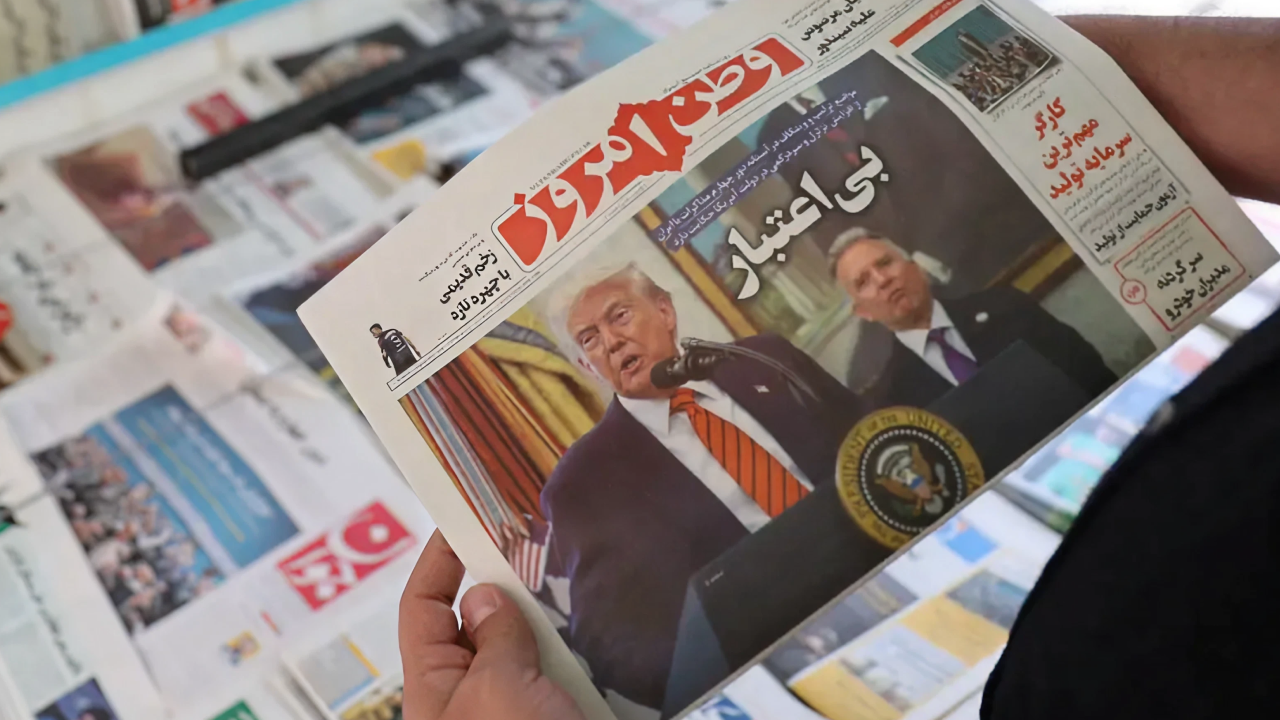

FOMC Minutes: Fed considers rate hike

FOMC Minutes: Fed Considers Rate Hike

The FOMC Minutes have been released—meeting logs that highly interest markets because they hint at the Fed’s future outlook. Here are the highlights.

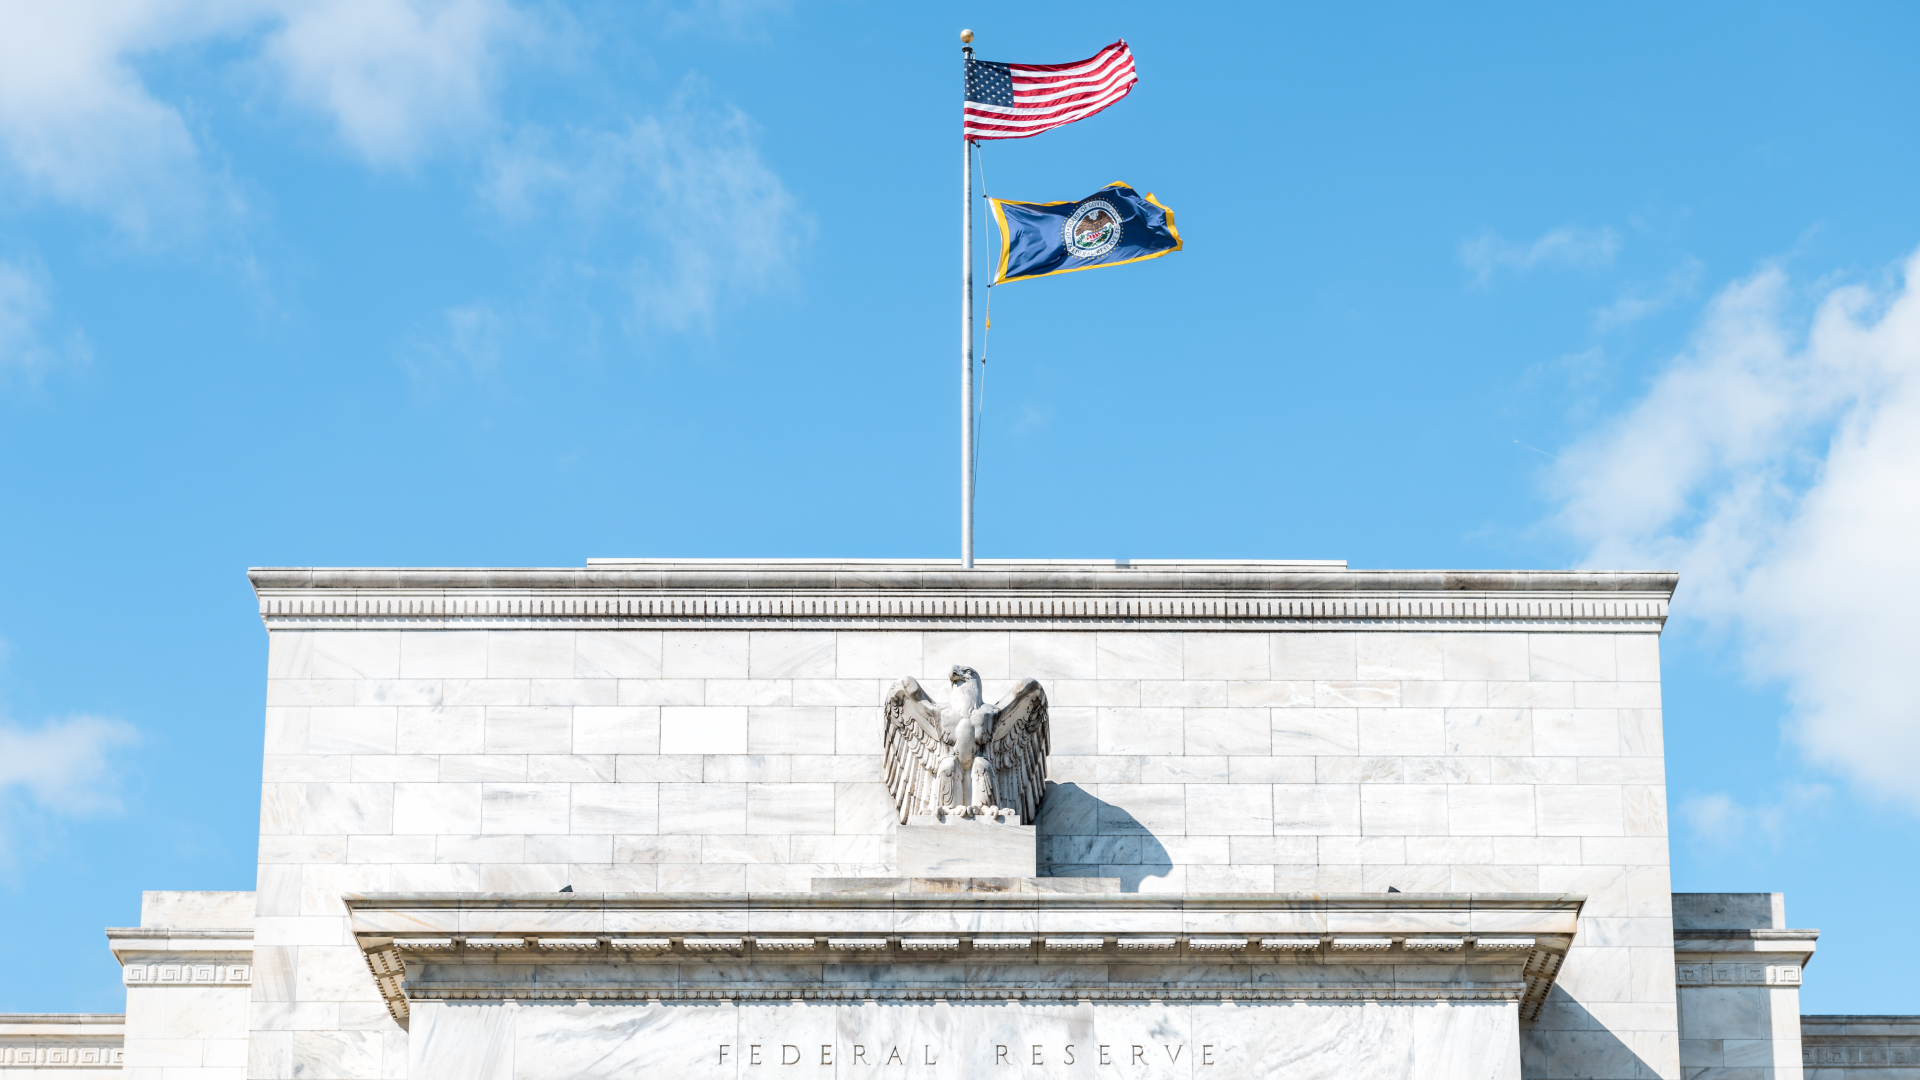
On May 20th, the FOMC Minutes were published—the Federal Reserve logs that show in detail the reasoning behind the FOMC’s decision (Federal Open Market Committee), the monetary policy meeting where interest rates are set. Markets pay close attention to this type of communication, especially since they often provide hints about the future. But first, let’s quickly look at the reference framework—relating to the last FOMC of April 28-29, the last one chaired by Jerome Powell before handing over the baton to Kevin Warsh.

The macroeconomic context: between inflation and the labor market

To understand the internal discussions within the Fed and their relevance, however, we need to take a step back and look at the numbers that Jerome Powell and his colleagues had on the table.

Inflation: May data

According to data published by the BLS (Bureau of Labor Statistics), inflation stood at 3.3% year-on-year. The increase, logically, was heavily driven by the rise in energy prices, triggered by the closure of the Strait of Hormuz and the conflict in Iran and the Middle East. This is a quite concerning picture: inflation is still running well above the Fed’s 2% target.

Interest rates (FOMC): the April 29 decision

At the end of the late-April meeting, the FOMC left interest rates unchanged: during the press conference, outgoing Fed Chairman Jerome Powell defended the decision to keep the so-called “easing bias” in the statement—language indicating an inclination toward future cuts—explaining that changing the wording is a signal in itself and the Fed prefers to maintain a more conservative approach.

So, to sum up, the United States is in a situation where inflation has started rising again due to geopolitical shocks and massive investments in artificial intelligence (AI), which are overheating demand. On the other hand, the unemployment rate stands at 4.3% with new job creation remaining contained. Let’s move on to the Minutes.

FOMC Minutes: a shocking change of direction?

Let’s get to the core issue: what did the members of the US central bank say behind closed doors? The logs show a Fed that has almost completely shelved the question of the last two years—namely whether to cut rates—to start seriously considering the opposite scenario: raising them.

Reading the Minutes, it emerges that the majority of officials highlighted that “some monetary policy tightening would likely become appropriate if inflation were to continue to run persistently above 2%”. Furthermore, there is a clear preference for removing the so-called easing bias from the statement—the tendency to include rate cuts among the options—supporting the stance of the three presidents (Hammack, Kashkari, and Logan) who formally objected on that specific point. But there are also those who continue to favor a more dovish monetary policy: Stephen Miran, the Governor appointed by Trump following Adriana Kugler’s resignation, voted against, preferring—as always—a 25 basis point cut due to labor market risks.

On the risk management front, members agree that there are upside risks to inflation and downside risks to employment. The main fear is that prolonged high energy prices and trade tariffs could make inflation structural. For this reason, monetary policy does not follow a pre-set path, and members reiterated that future decisions will be taken meeting by meeting.

Next FOMC: what are the forecasts?

At the time of writing, CME Group’s FedWatch estimates on interest rate futures markets indicate a probability of nearly 50% of seeing at least one 25 basis point rate hike by the end of this year. Regarding the next FOMC, No Change—unchanged rates—is priced in as a certainty at 99.1%, while the remaining 0.9% relates to a hike.If you’ve made it this far, it means this topic interests you: join our Telegram channel and/or subscribe to Young Platform so you don’t miss the news moving the markets!

Iran: three months of war. How is the crypto market reacting?

Israel-Iran War: Market Update

The war between Israel, the US, and Iran continues: the Strait of Hormuz is repeatedly closed and reopened, leaving stock markets confused. And the crypto market?

The war between the United States-Israel and Iran has entered its third month: the Strait of Hormuz, a fundamental chokepoint through which one-fifth of the world’s oil and LNG production passes, remains semi-blocked, even though Iranian and US delegations seem intent on reaching an agreement. Global stock markets, of course, have no idea what the future might hold but remain highly optimistic. The crypto market follows, but has been feeling the strain lately: what is the situation?

War in Iran: the timeline of the conflict

On the Italian morning of February 28, the United States and Israel officially launched a series of coordinated bombings against Iran: in less than 24 hours, they achieved one of the main goals of the raids, eliminating Ayatollah Ali Khamenei, supreme leader of the Islamic Republic of Iran. A few hours after the event, the Revolutionary Guards, one of the three Iranian armed corps, declared the Strait of Hormuz closed: “If anyone attempts to pass, the heroes of the Revolutionary Guards and the regular navy will set those ships on fire”.

In the days that followed, the traffic in the Strait was drastically reduced: media and international security organizations reported the presence of naval mines in the channel. The price of energy commodities, consequently, skyrocketed: through the Strait of Hormuz passes between 25% and 30% of global oil and LNG (liquefied natural gas) production. With the opening of the front, Brent—the international benchmark—skyrocketed and remained steadily above $100 a barrel.

The three subsequent months saw a continuous alternation between mutual threats and negotiations, but the warring parties have managed to find common ground: officially, as we write, the United States and the Islamic Republic of Iran have temporarily buried the hatchet.

In this regard, over the weekend of May 23-24, major international media spoke of steps forward toward a definitive end to the war: CNN, for example, reports that “the United States and Iran show signs of progress in efforts to end the conflict, but crucial details of a framework agreement are still being negotiated”.

Although the situation is not entirely clear, the aforementioned news has brought the price of Brent below $100 a barrel for the first time in more than a month.

The performance of major stock indices

When energy prices grow out of proportion, the real economy suffers: companies spend more to produce due to the across-the-board increase in costs, such as transportation and electricity in general. The result: the price hikes, in the end, are passed on to the consumer, who sees a generalized rise in prices, also known as inflation.

And markets know all too well that rising inflation increases the likelihood of an interest rate hike—the next FOMC meeting will take place in less than a month. What does all this mean in numbers?

Starting with the United States, the three main indices have returned well into positive territory: since day one of the conflict, the Dow Jones is gaining 3.4%, while the S&P 500 and the Nasdaq 100 have set new All-Time Highs and are gaining 8.6% and 18% respectively—the Dow Jones suffers more than the other two precisely because it is more exposed to energy price variations.

The turning point, i.e., the bottom followed by the trend reversal, occurred on March 30. Since that day’s close, the three indices have staged a significant recovery: the Dow Jones, S&P 500, and Nasdaq 100 are gaining 11.86%, 17.8%, and 30.4% respectively.

But let’s fly to Europe, which is faring slightly worse: the Eurostoxx 50 (STOXX), the index that includes the top 50 European companies, has returned to positive territory for the first time since the start of the conflict: currently, it is up 2% compared to the close on March 2. However, the situation is not bright for everyone: in detail, London is down 2.9%, Paris 1.8%, while Frankfurt and Milan, on the contrary, are gaining 2.5% and 8.15% respectively.

In Asia, the situation has turned more favorable: the Nikkei, which represents the 225 most important companies in Japan, updated its all-time highs and, since March 2, is marking a +13.6%, while the KOSPI, the main South Korean index which had lost up to 18% with the outbreak of the war, reversed its trend with an impressive performance: +35.5% since the close on March 3. In China, the Hang Seng travels in negative territory: -1.6% since Day One.

Focus precious metals: gold and silver

In this chaos, one would expect good behavior from precious metals, universally conceived as safe havens in times of strong turbulence. That is not quite the case.

The price of gold, since the start of the bombings, has dropped by 14.1%, closely followed by silver (-12.5%). At the same time, despite not being a precious metal, the dollar returns to assuming a store-of-value role: in these ten weeks, the DXY—the dollar vs six major foreign currencies—is gaining 1.15%.

And the crypto market?

The crypto market seems to be linked, with due proportion, to the performance of the US tech sector: since Friday, February 27, Bitcoin is gaining 17.8%, after weeks of high volatility in which it targeted $70,000 four times, finally managing to break that ceiling and launch an attack on $80,000; Ethereum is underperforming but still growing by 9.8%; Ripple and Solana, on the other hand, post more modest performances, rising by 0.5% and 5% respectively. In general, the Total Market Cap has grown by approximately 308.5 billion dollars (+13.7%).

Some interesting data

According to BitcoinTreasuries.net, over the past thirty days, Public Companies have increased their Bitcoin stakes by 2.2%. In other words, listed companies—such as Strategy (MSTR)—have brought the total held in Bitcoin to 1.24 million BTC. The opposite is true for ETFs and exchanges: recent outflows have reduced the amount of BTC held by 0.2% (total: 1.62 million BTC).

In this regard, it is interesting to compare the stakes of the most representative entities in these two categories: Strategy (MSTR) for Public Companies and IBIT for ETFs. It is an extremely close head-to-head: the former holds 843,738 BTC, the latter 804,921 BTC.

What lies ahead?

It is the big question that crypto (and non-crypto) investors have been trying to answer for days. Clearly, no one has the answer, because the future cannot be predicted. In these moments, the best thing to do is to study the fundamentals and understand how protocols work.

Don’t know where to start? Don’t worry: our Academy is excellent for those who want to start, but also for those who are already experts and want to review.

USA Inflation: Today’s CPI Data

US CPI Data Today: Inflation Results & Market Impact

The Consumer Price Index (CPI) has been released, the data used to estimate inflation in the United States of America

The Consumer Price Index (CPI) has been released, the data used to estimate inflation in the United States of America. The fate of the markets hinges on US inflation and, therefore, on the Consumer Price Index (CPI) data published on May 12. In this article, we will find out what the CPI is, why it is important, and analyze the latest available data.

CPI meaning

Technically, the CPI (Consumer Price Index), or Consumer Price Index, is a fundamental economic indicator that measures how much the prices of everyday goods and services have changed. In other words, the CPI tells us how much it costs to live today compared to the past.

The CPI is calculated by collecting price data on a representative “basket” of goods and services that consumers typically purchase. This basket includes a variety of products, such as food, clothing, housing, transportation, education, healthcare, and other common goods and services. The United States Bureau of Labor Statistics (BLS) collects prices every month in 75 urban areas and compares them with those of the previous period.

Why is it important?

The CPI is used to measure inflation, meaning how much the cost of living increases. If the CPI goes up, it means prices are rising and that, on average, one has to spend more to live like they did before.

Bitcoin and CPI: how are they connected?

The Consumer Price Index is one of the main indicators that the members of the Federal Reserve take into consideration when they have to make choices regarding monetary policy: generally, when inflation drops, the FOMC (Federal Open Market Committee) is more comfortable cutting rates, and vice versa.

Currently, however, analysts believe that the Fed Chairman and the Board of Governors presiding over the FOMC are inclined to keep rates steady for the upcoming meetings as well, in order to assess the impact of the cuts made during 2025.

Bitcoin generally reacts positively to rate cuts: when money is cheaper, investors are more inclined to shift liquidity toward more volatile assets in search of higher returns. In this hypothetical scenario, equities and crypto are among the top choices.

In any case, the CPI remains a fundamental tool for understanding the inflation trend and trying to predict the behavior of the American central bank: if you’re interested in the topic, you can find all the dates for 2026 in our article on the Fed’s meeting schedule.

The last time it happened

The latest CPI for April came in higher than forecasts and the previous month’s CPI: the data, consistent with what was written above, did not influence the Fed’s choices, which, as we anticipated, left rates at December levels.

So, how did today’s CPI turn out?

CPI May 2026: data analysis

On May 12, 2026, the BLS published the report on price changes for US consumers. According to the report, the monthly CPI (MoM) increased by 0.2% compared to the previous month, while the year-over-year CPI (YoY) grew by 3.8% compared to April’s measurements. This data, there is no point in wrapping it in a euphemism, is negative, as year-over-year inflation does not seem to stop and is moving further and further away from the Fed’s target of 2%.

Will the CPI for June be higher? It is highly probable: even if the war involving the United States, Israel, and the Islamic Republic of Iran were to end, the effects of a prolonged increase in the price of Brent will be felt for a long time.

Interest rate cut on the horizon? Forget about it

What will the Fed decide regarding interest rates at the June 16-17, 2026 FOMC? On the FedWatch Tool, the premier instrument for these kinds of forecasts, the odds of a 25-basis-point cut are now down to zero. The No Change is set at 99.9%, with a remaining 0.1% linked to a rate hike.

Historical data of the YoY CPI in 2026

Here is how the CPI is tracking in 2026:

May 2026: +3.8% (forecast 3.7%)

April 2026: +3.3% (forecast 3.3%)

March 2026: 2.4% (forecast 2.4%)

February 2026: 2.4% (forecast 2.5%)

January 2026: 2.6% (forecast 2.7%)

2025 Data:

December 2025: 2.7% (forecast 3.1%)
October 2025: 3% (forecast 3.1%)
September 2025: 2.9% (forecast 2.9%)
August 2025: 2.7% (forecast 2.7%)
July 2025: 2.7% (forecast 2.7%)
June 2025: 2.4% (forecast 2.5%)
May 2025: 2.3% (forecast 2.4%)
April 2025: 2.4% (forecast 2.5%)
March 2025: 2.8% (forecast 2.9%)
February 2025: 3% (forecast 2.9%)
January 2025: 2.9% (forecast 2.9%)

To continue following these market updates, join our Telegram channel or click below!

Unemployment and Non-Farm Payroll: US data

Emploi aux États-Unis : les données et la réaction des marchés

US employment data has been released: Non-Farm Payrolls and the unemployment rate. How did the markets react?

On Wednesday, February 11th, the American BLS (Bureau of Labor Statistics) released labor market data. Specifically, reports were published on Non-Farm Payrolls (NFP), representing new jobs created excluding the agricultural sector, and the unemployment rate. What is the current situation? How did the markets behave and why?

On Friday, May 8, the US BLS (Bureau of Labor Statistics) released the latest labor market data. Specifically, the report covers Non Farm Payrolls (NFP)—the number of new jobs created excluding the agricultural sector—and the unemployment rate. What is the current situation? How did the markets behave, and why?

The data: Non Farm Payrolls and unemployment rate

The May 8 release is the fifth of 2026, but let’s get straight to the point: NFPs grew by 115,000, a figure far higher than expectations, which estimated 62,000 new jobs, while the unemployment rate remained unchanged at 4.3% compared to April, matching forecasts.

The implications

As is well known, the financial world places great importance on these reports since the labor market is a highly scrutinized indicator, especially since the Federal Reserve released its March FOMC Minutes. In evaluating its monetary policy moves, the US central bank is closely monitoring both the employment situation and price stability. With the outbreak of the war in Iran—you can find the recap of market reactions since the start of the conflict at this link—and the resulting inflationary pressures, it is crucial that at least the first of these two indicators remains positive.

Based on these statements, the logical chain guiding the markets since the beginning of 2026 is as follows: if NFPs fall below forecasts and the unemployment rate rises, the likelihood increases that the FOMC could raise interest rates later this year—if you are interested in monetary policy meetings, you can find the complete 2026 FOMC meeting schedule here.

Forecasts for the April FOMC

The CME Group’s FedWatch, a tool that calculates the probability of FOMC rate cuts based on Fed Funds futures prices, currently puts ‘No Change’ at 98.1%, while a 25-basis-point cut—i.e., 0.25%—stands at a 0% probability. That’s right: the remaining 1.9% represents a rate hike.

Even though the next meeting is still some time away, the May Consumer Price Index—the second since the outbreak of the conflict in Iran—points to a significant return of inflation: the price of Brent crude oil, which is now hovering steadily around $100 a barrel, is driving up the overall cost of living.

What’s next?

Over the next few days, we will most likely see a highly volatile market, particularly on the crypto side. The current environment is heavily driven by emotions, which can shift hundreds of billions of dollars in capital in just a matter of hours.In any case, we will be right here to keep you updated on the news and events moving the markets. Subscribe to to Young Platform so you don’t miss out on what matters!

ECB Meeting April 2026: The Results

Réunion BCE décembre 2025 : résultats et taux d'intérêt

The ECB met on April 30 to decide the Eurozone’s monetary policy: what happened to interest rates? Here are the results.

The European Central Bank meeting on Thursday, April 30, 2026, saw the members of the Governing Council gather to discuss, among other things, the Eurozone’s monetary policies. On the table were the decisions regarding interest rates. What happened?

ECB Meeting: what is the economic context?

The third ECB meeting of 2026 took place against a complex economic backdrop where future uncertainty reigns supreme, between Donald Trump’s unpredictability and conflicts that seem destined to drag on. The main topics focused heavily on economic growth, which has been deeply affected by geopolitical instability, and inflation, currently at 3% according to the latest reading—higher than expected. Let’s look at what was decided in detail.

The ECB leaves interest rates unchanged

Thursday, April 30, Frankfurt. The Governing Council of the European Central Bank has announced its monetary policy decision for the Eurozone. As expected by the majority of analysts, the ECB has decided to keep its three key interest rates unchanged. Consequently, the deposit facility rate remains steady at 2%, the main refinancing operations rate at 2.15%, and the marginal lending facility rate at 2.40%.

The reasoning behind the choice

The ECB explained that the decision is summarized in this statement: “New information is broadly in line with the previous assessment of inflation outlooks, but upside risks to inflation and downside risks to growth have intensified.”

A deterioration of the outlook is largely attributable to the outbreak of the war in Iran and all its subsequent consequences: “The implications of the war for medium-term inflation and economic activity will depend on the intensity and duration of the energy price shock, as well as the extent of its indirect and second-round effects.”

In this context, as is only logical, “the longer the war continues and the longer energy prices remain elevated, the greater the likely impact on broader measures of inflation and the economy.”

With this meeting, the ECB confirms a more cautious stance

The ECB meeting in March 2026 decreed the maintenance of interest rates at February levels: this is the seventh consecutive meeting with this outcome. Despite an extremely uncertain situation with skyrocketing energy prices, the ECB writes that the Eurozone might be in a better position than one might think: since we entered this phase of sharp increases with inflation already close to 2% (the ECB’s stated target), “longer-term inflation expectations remain firmly anchored, although those over shorter horizons have risen significantly.”

In this context, the ECB Governing Council remains in a wait-and-see posture: “the Governing Council will monitor the situation closely and will adopt a data-dependent approach whereby decisions are taken from meeting to meeting.”

Naturally, the coming weeks will be crucial to see if the data confirms the current scenario and what the next move from the Eurotower will be.

The next meeting is scheduled for June 10-11, 2026: what will the members of the Governing Council decide? To ensure you don’t miss any upcoming meetings, take a look at our 2026 ECB meeting calendar—either way, we’ll be here to cover them. Subscribe to Young Platform to stay up to date on the things that matter!

Tariffs and Iran: Markets price in uncertainty

Tariffs and Iran: Markets price in uncertainty

The 15% tariffs and geopolitical tensions frighten the markets: US futures in the red, crypto follows, the dollar loses ground, and gold rises

The Supreme Court’s ruling provokes a reaction from Trump, who introduces global tariffs at 15%. Meanwhile, the United States continues to mass its military fleet in the Mediterranean: is an attack on Iran getting closer? Investors, playing it safe, enter risk-off mode: fleeing from the most volatile assets in search of stability. Here is the situation.

Tariffs and Iran: the macro context

The spark that made the markets lose their nerve has a name: Donald Trump. Indeed, while the potential military escalation in Iran, and the ensuing uncertainty, have occupied the front pages of newspapers for weeks, the move that triggered the sell-off comes from the White House. What happened?

Trump did not appreciate the US Supreme Court’s ruling

The news arrived on Friday, February 20 like a bolt from the blue: according to the US Supreme Court, most of the tariffs imposed by Trump are illegal. The President of the United States, obviously, did not appreciate the ruling and declared that he already has a “backup plan” ready: more tariffs.

The occupant of the White House, on the immediately following weekend, introduced additional 10% global customs tariffs, only to raise the stakes by increasing the threshold to 15%. On his social media platform Truth, Trump literally wrote: “I, as President of the United States of America, will immediately raise the global tariffs by 10% applied to countries – many of which have ‘robbed’ the United States for decades, without suffering consequences (until I arrived!) – bringing them to the 15% level, a threshold fully permitted and confirmed in legal venues.”

Investors in risk-off mode

This combo caused a sharp shift in sentiment: we have entered a phase of strong risk-off, where capital exits very quickly from assets considered volatile or risky to seek safety in traditionally more stable havens.

To give an example, the Fear & Greed Index – the index that measures the fear of crypto investors – is currently sitting at 5, “Extreme Fear”. Conversely, and by the book during geopolitical crises, gold scored a +3% starting from Friday the 20th, returning above $5,000/ounce.

Market update: equities and crypto numbers

On Wall Street, the picture seems clear even at the time of writing, before the stock markets open: Dow Jones futures are down 0.3%, while those on the S&P 500 and the Nasdaq 100 are losing 0.3% and 0.4%, respectively.

The price of oil is also feeling the impact: Brent futures are down 0.5% to $71.2 a barrel, while WTI – the US crude – stands at $66.11 a barrel, down 0.6%.

The crypto market follows suit: in the last few hours, the total market cap of the sector managed to shed over $100 billion in two days, only to recover half of it on Monday. Bitcoin recorded a heavy drop of about 5.5%, touching $64,300 but bouncing back and settling, for now, around $66,300.

The situation regarding liquidations is very interesting: about $468 million in long positions were liquidated between Sunday and Monday. But that’s not all: a single trader saw a whopping $61.5 million go up in smoke in a single trade.

Two more pieces of side info, between Ethereum and Nvidia

Let’s close with two news items that could cause further repercussions on the market, given their relevance.

First of all, the on-chain data tracked by Lookonchain indicate a movement that, generally, the community doesn’t like very much, to put it mildly: Vitalik Buterin, the founder of Ethereum, has gone back to selling ETH. Over the weekend of February 21-22, Buterin sold 1,869 ETH, cashing in more than $3 million. Ethereum, during those same hours, dropped by up to 6.4%, even pushing below $1,850.

Finally, on Wednesday, February 25, Nvidia will publish its highly anticipated quarterly earnings. The reason behind the importance of these numbers should be clear to the whole world: Nvidia is not just a tech company, it is the engine of the entire narrative linked to Artificial Intelligence and, by extension, of the US stock market over the last two years.

If the data were to disappoint and fail to beat the very high forecasts of analysts, the event could trigger a further wave of volatility, dragging down with it the tech sector in general, cryptos included.

What will happen in the coming months? Impossible to say, easier to report on: sign up for Young Platform to stay up to speed!

Tariffs, the US Supreme Court rules them illegal

According to the US Supreme Court, the reciprocal tariffs imposed by Donald Trump are illegal: the ruling arrived on Friday, February 20

The reciprocal tariffs introduced by President Donald Trump on the occasion of “Liberation Day” on April 2, 2025, have been ruled illegal by the United States Supreme Court. The reason revolves around the methods by which they were applied. Let’s quickly see what happened.

US Supreme Court: “Congressional authorization is required”

On the Italian afternoon of February 20, the United States Supreme Court ruled on the legality of the reciprocal tariffs imposed by Donald Trump.

Chief Justice John Roberts drafted the majority opinion, which reads: “President Trump claims the extraordinary power to unilaterally impose tariffs of unlimited magnitude, duration, and scope. Given the breadth, history, and constitutional framework of such claimed powers, he must demonstrate clear Congressional authorization to exercise them“.

In short, SCOTUS – the Supreme Court of the United States – is telling us that the emergency powers Trump attempted to invoke, therefore, “are not sufficient“.

The tariffs, in fact, were introduced by bypassing the standard procedure that requires approval from the United States Congress: to do so, Donald Trump appealed to IEEPA, the International Emergency Economic Powers Act.

IEEPA, for context, is a US federal law that allows the President to declare the existence of “a threat to the national security, foreign policy, or economy of the United Statesthat originatesin whole or substantial part outside the United States” – as stated in Article 50 of the United States Code – and act accordingly.

In this case, according to Trump, the trade deficit between the United States, heavy importers, and the rest of the world, which exports heavily to the US, constituted a threat to the national economy. And tariffs represented the tool to reduce this disparity.

The blocked tariffs are a stinging defeat for Trump

To understand the scale of the event, we must contextualize it politically: this ruling is, according to many analysts, the most significant legal defeat that the second Trump administration has suffered from a conservative-majority Supreme Court. There is, however, one unresolved issue: if the tariffs are unconstitutional, what happens to the money already collected?

The Supreme Court, in fact, while declaring the maneuver illegal, did not specify what should happen to the over 130 billion dollars in tariffs already collected by the federal government. An issue that will most likely translate into an avalanche of lawsuits from damaged importing companies.

What’s next?

According to some sources, President Trump reportedly stated that this decision is a disgrace” and that “I have a backup plan“. The fundamental point, however, is one: Trump’s trade strategy, based on using tariffs as a negotiating lever against everyone, has just been neutralized by his own country’s judiciary.

How will the markets react to this sharp change? Sign up to Young Platform, and we’ll tell you all about it!

Iran: Bitcoin as a tool of resistance

In Iran, resistance also involves cryptocurrencies: where the national currency is worthless, Bitcoin is a tool for survival

Iran is experiencing a period of internal revolution. At the end of December, mass demonstrations erupted against the country’s governing regime, which had triggered an unprecedented economic crisis. Here, Bitcoin is a tool of resistance.

What is happening in Iran? The context between inflation and repression

Iran is facing an extremely complex internal situation, with mass protests and outbreaks of civil war, often violently repressed. It all began around 28 December, when a group of protesters, mostly traders from the bazaars of the capital Tehran, took to the streets to protest against the Islamic regime.

The protests are mainly focused on the economic situation: with annual inflation at 40% and the price of necessities skyrocketing, the Islamic Republic of Iran is in the midst of an unprecedented financial crisis. Since 7 January, the rial, the national currency, has been officially valued at 0 (zero) euros.

A few days later, what seemed like a localised street movement took on a national dimension, reflecting widespread discontent.

At the same time, repression is becoming increasingly intense: the number of deaths is rising, although we do not know the exact number, and the regime is blocking access to the internet nationwide.

At the time of writing, the government led by Ayatollah Ali Khamenei is in serious difficulty: many analysts consider this one of its weakest moments since 1979, when the previous ruler, the Shah of Persia, was overthrown. On the other hand, the violence of the Iranian security forces against the demonstrators testifies to their desire to stifle dissent and maintain control.

Iran and Bitcoin: what do the on-chain data say?

In Iran, Bitcoin serves as a means of survival and, by extension, as a form of resistance. This is according to Chainalysis’ report, in the section entitled ‘Inside Iran’s Growing £7.8 Billion Crypto Ecosystem’. What is the on-chain picture? What can be deduced? In the words of the report, ‘the most recent data available to us reveals a significant change in on-chain behaviour during the current mass protest movement‘.

Methodology

To reach this conclusion, the Chainalysis team of analysts examined both the average amount transacted – i.e. withdrawn from exchanges – in dollars and the number of transactions from exchanges to wallets, both daily. In addition, to attribute changes to specific events, the analysis was divided into two periods: “before the protest (1 November – 27 December)” and “during the protest (28 December – 8 January, the day of the internet blackout)“. Finally, transactions were divided into categories: small withdrawals (under £100), medium (under £1,000), large (under £10,000) and very large (under £100,000).

Results

Comparing the period “before the protest” with that “during the protest“, a substantial difference in on-chain behaviour emerges, to quote Chainalysis’ thesis.

During the protest, the £1- £100 range saw a 111% increase in exchange withdrawals and a 111% increase in transactions compared with the pre-protest period. The situation was different for the ranges between £101 and £1,000 and between £1,001 and £10,000, where the growth was even more pronounced: in terms of withdrawals, the former recorded an increase of 228%, the latter 236%; in terms of the number of transactions, however, the £101-£1,000 bracket ‘stopped’ at +128%, while the £1,001-£10,000 bracket saw an expansion of 262%.

What does all this mean?

This behaviour, according to Chainalysis, represents a logical and rational response to the collapse of the Iranian rial, which, as noted, is currently worth absolutely nothing.

Bitcoin, amid this chaos, has taken on the role of a lifeboat on a sinking ship. Bitcoin is the alternative asset that has allowed Iranians to protect their savings from the nefarious policies of a bloody regime. But there is more.

“Bitcoin’s role in this crisis,the analysts conclude, “goes beyond simple capital protection: for many Iranians, it has become an element of resistance, providing liquidity and freedom of choice in an increasingly restrictive economic environment.”This is thanks to its decentralised, anti-censorship and self-custodial nature.

Diversification: what it is and why it is important

Diversification

Diversification is one of the fundamental concepts of investing, even though too many people dismiss it. But what is it? And why is it so important? 

Diversification is a fundamental principle that should guide the investment strategy of anyone who wants to enter the world of crypto. It is a concept that belongs to traditional finance, but one that has accompanied humanity throughout the entire process of civilisation. In this article, we will try to answer two questions that are as simple as they are comprehensive: what is diversification? And why is it so important?

Diversification: what is it and what does it mean?

In finance, diversification is defined as a strategy or fundamental principle for minimising risk: in concrete terms, it means spreading financial resources across a diverse range of assets, rather than concentrating capital on a single investment. The prime example, the timeless classic used by those who want to explain this concept in a simple way, is that of eggs in a basket. More precisely, the phrase ‘don’t put all your eggs in one basket!‘, accompanied by an index that swings back and forth, solemn as an oracle. 

Joking aside, the comparison is apt: diversification means avoiding putting all your eggs in the same basket. The reason is simple: if all your eggs are in one basket and, unfortunately, it slips out of your hands, you’ll end up with an inedible omelette. In other words, you would have lost everything. But if the same number of eggs had been wisely distributed across several baskets, you would have lost the contents of one of them, preserving the rest. Similarly, as you can easily understand, spreading your investments across several different assets greatly reduces the risk of losing everything in one fell swoop. And your portfolio will thank you for it.

If you think about it, as we mentioned in the introduction, this rule has been around for centuries, since the dawn of civilisation. As early as the Neolithic period, communities raised several types of livestock at the same time – including cows, sheep and goats – in order to have different qualities of food and material resources available, but also to prevent, for example, a single disease from wiping out all their animals. Even during the Middle Ages, farmers understood the importance of growing several types of cereals using a three-year rotation system. The advantages were obvious: improved soil fertility, increased overall production and reduced risk of famine, as losses caused by a bad harvest were offset by the others. 

Among other things, diversification also determines our diet. Obviously, it would be wonderful to eat pizza every day, but it is essential to alternate with healthier, more boring foods to avoid digging our own graves. In short, if diversification guides every aspect of human life, why shouldn’t it do the same for our investments?

Diversification: why is it important?  

Diversification, as previously explained, is an essential criterion from a conservative perspective, i.e. risk reduction. At this point, one might rightly object: ‘I don’t care about risk, I want to put all my money on that meme coin and become a millionaire in three days’. Fair enough, but this is not investing, it is gambling, and the chances of winning when gambling are extremely low. Returning to investing, diversification also makes sense from a profit perspective, as it allows you to avoid missing out on the asset or assets of the decade. 

Let’s take a concrete example from the internet megatrend of the early 2000s, just after the dot-com bubble burst. At that time, the main use case for the internet was search, and Google was the undisputed king. You could have legitimately thought that the Californian company was the only horse worth betting on, as it dominated almost non-existent competition. Today, that choice would have undoubtedly proven you right, as Google’s share price has grown by more than 6,000%, but you would have kicked yourself. Why? Because by viewing the internet as a tool designed exclusively for online search, you would have missed out on other companies such as Netflix and Amazon, which have outperformed Google by carving out their own slice of the market. 

Diversifying in the crypto world

Diversification in the world of cryptocurrencies follows the dynamics of the example just described: it depends on how you understand blockchain and its use cases. Bitcoin is, without a doubt, the dominant player in this world, as it alone accounts for more than 64% of the market. However, its usefulness is ‘limited’ – for now – to payments and being a store of value, although BTCFi could show promise. So, if you believe that blockchain will not go beyond Bitcoin, then it makes sense to invest everything in it, at your own risk. 

It is undeniable, however, that blockchain is slowly but surely making its way into other strategic sectors, and the future could hold surprises in this regard. The key point is to take a step back and look at the situation as a whole: don’t focus on the present so as not to be misled by heuristics and cognitive biases but, as the philosopher Baruch Spinoza would say, consider things sub specie aeternitatis – in the light of eternity – in an absolute and universal sense. This is precisely what diversification means: avoiding overexposure to a single cryptocurrency, both to reduce risk and to avoid missing out on huge opportunities such as Ethereum, which rose by 1,880% between 1 January 2020 and 1 January 2025. 

Clearly, in order to invest wisely, you need to keep up to date and stay on top of what is happening in this constantly evolving world. Our impartial advice is to subscribe to our Telegram and WhatsApp channels or directly below, so that you can receive all the relevant news every day, ready and packaged for you!

The price forecasts in this article are based on sources believed to be reliable, but do not guarantee the market’s future performance. They do not constitute a recommendation or financial advice. Investing in crypto-assets involves risks, including the potential loss – even total – of the invested capital. Users are required to conduct independent evaluations before making economic and/or investment decisions and to consult their own specialised financial advisor.

ECB rates: when is the next meeting? The complete 2026 calendar to keep an eye on!

ECB meeting calendar

The 2026 calendar of meetings not to be missed

When will the next ECB meeting be held? The calendar of the European Central Bank (ECB) is closely monitored, not only by investors and market experts but also by ordinary citizens throughout the Eurozone. People follow the Central Bank’s meetings with interest and concern, as its decisions can significantly impact household finances.

Each ECB meeting is highly anticipated and preceded by numerous predictions about Christine Lagarde and the Governing Council’s actions, whose statements are carefully analysed. Below is the 2026 calendar (and beyond) of meetings to track, so you won’t miss any important appointments with the Frankfurt-based institution.

Next ECB monetary policy meeting: 2026 calendar

The European Central Bank (ECB) has an annual calendar with several scheduled meetings. Typically, it holds meetings twice a month; however, monetary policy decisions are discussed only eight times a year. These meetings are highly anticipated, as they can significantly influence financial markets and the economy.

The ECB’s calendar is divided into two categories: upcoming monetary policy meetings and non-monetary policy meetings. 

Monetary policy meetings are held on Thursdays and are followed by a press conference featuring ECB President Christine Lagarde. During this conference, she presents the decisions to the public and journalists live on television. Read the article: ECB press conference live: how and where to watch the event?

What topics are discussed in each ECB monetary policy meeting? Key issues generally include growth and GDP in the Eurozone, quantitative tightening, inflation trends, and interest rates.

Decisions regarding interest rates are particularly crucial because they directly affect citizens’ savings and purchasing power. For example, rising interest rates can increase mortgage costs. For the ECB, adjusting interest rates is a vital tool for achieving its primary goal: maintaining price stability.

That said, the initial question arises: when will the next ECB meeting take place

The 2026 calendar of monetary policy meetings

  • 4-5 February 2026
  • 18-10 March 2026
  • 29-30 April 2026
  • 10-11 June 2026
  • 22-23 July 2026
  • 9–10 September 2026
  • 28-29 October 2026
  • 16-17 December 2026

Want to stay ahead of the curve? Sign up for Young Platform!

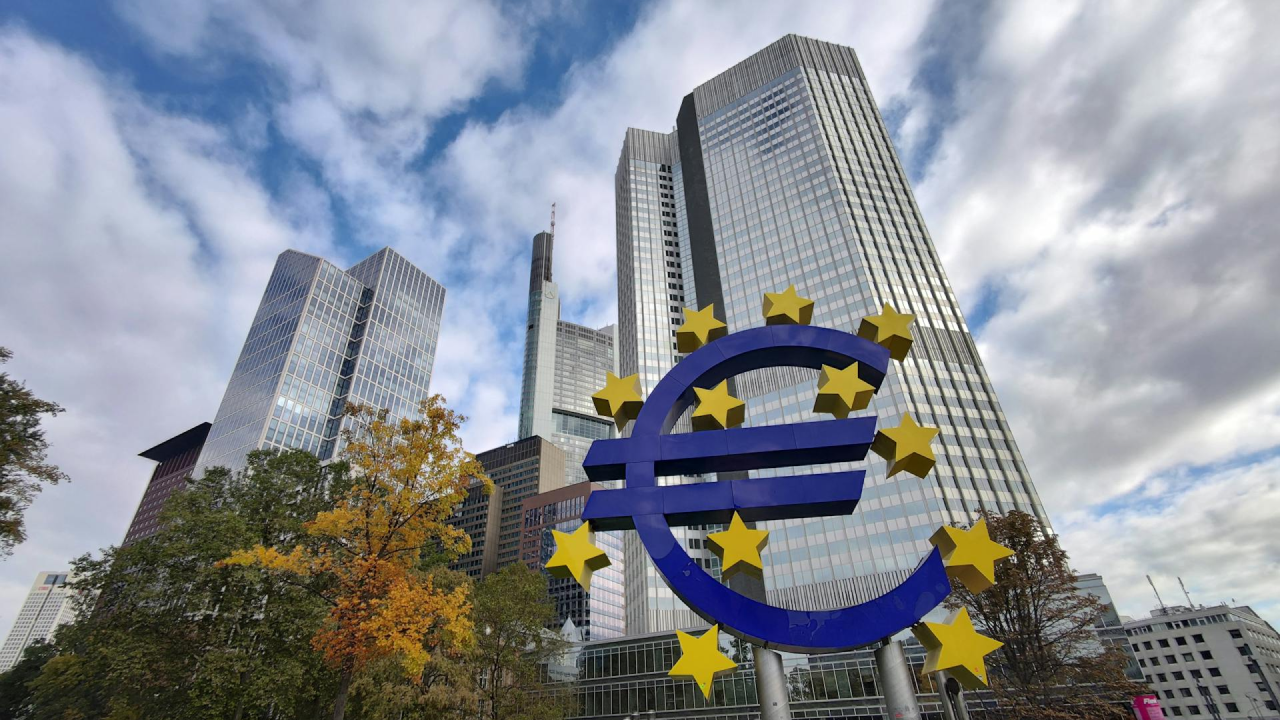
Except for the September meeting, which will take place at the Deutsche Bundesbank – the German central bank – all ECB meetings in 2026 will be held at the Eurotower in Frankfurt, the ECB’s headquarters. It will be chaired by the Governing Council of the European Central Bank, the institution’s main decision-making body.

This comprises President Christine Lagarde, Vice President Luis de Guindos, four members appointed from among the leading Eurozone countries, who hold office for eight years, and the governors of the national central banks. 

After each meeting, investors closely monitor market reactions to the European Central Bank’s decisions. Some of these also impact the cryptocurrency market. For this reason, upcoming ECB meetings, such as those of the Federal Reserve (see the Fed’s 2026 meeting calendar), should be kept in mind. 

On Young Platform, Italy’s leading cryptocurrency exchange, you can check cryptocurrency prices alongside reports on each ECB meeting. 

Discover Young Platform

Next non-monetary policy ECB meeting: 2026 calendar

The ECB meeting calendar also includes sessions that do not address monetary policy. On these occasions, the European Central Bank also carries out other tasks and responsibilities, such as banking supervision for the Eurozone. Here are all the dates of the upcoming meetings: 

  • 25 February 2026
  • 8 April 2026
  • 20 May 2026 
  • 30 September 2026
  • 18 November 2026

ECB: 2025 meeting calendar

  • 29-30 January 2025
  • 5-6 March 2025
  • 16-17 April 2025
  • 4–5 June 2025
  • 23-24 July 2025
  • 10-11 September 2025
  • 29-30 October 2025 (at the Bank of Italy in Florence)
  • 17-18 December 2025

ECB: 2024 meeting calendar

  • 25 January 2024 
  • 7 March 2024
  • 11 April 2024
  • 6 June 2024
  • 18 July 2024
  • 12 September 2024
  • 17 October 2024 (at the Bank of Slovenia)
  • 12 December 2024

ECB: meeting calendar for 2023

  • 2 February 2023
  • 16 March 2023
  • 4 May 2023
  • 15 June 2023
  • 27 July 2023
  • 14 September 2023
  • 26 October 2023 
  • 14 December 2023

The next ECB meeting in 2026 is scheduled shortly. However, this year’s meeting schedule is packed, and there will be plenty of opportunities to discuss the Eurozone economy. Want to stay updated effortlessly? Sign up for Young Platform so you don’t miss the news that moves the markets!