How will the cost of variable-rate mortgages vary in the coming months? To predict this, it is necessary to analyse the central forecasts on Euribor, the European reference interest rate.
What the latest forecasts tell us about the Euribor, or Euro Interbank Offered Rate, which is the average interest rate paid by banks in the eurozone to lend money to each other and the benchmark for variable-rate mortgages.
In recent months, Euribor forecasts, particularly three-month ones, have attracted the attention of many financial industry experts, who have analysed various factors to predict future fluctuations. What is the current Euribor forecast for the last months of 2024?
Euribor forecasts: what will happen in the short term?
The first actor to provide its Euribor forecast is, as one would hope, the European Union, through the ‘Spring 2024 Economic Forecast’, a report analysing, in a broad sense, the economic situation in Europe.
The executive summary of the document provides an overview highlighting the most important data for the Union, such as the Gross Domestic Product (GDP) growth rate and the inflation rate. It also includes some forecasts on Euribor and the factors that will influence it.
Of course, the future of the Euribor is closely linked to the decisions of the European Central Bank (ECB) regarding interest rates. These were alreadyreduced by 25 basis points in June and currently stand at 4.25%. According to the Union, these will reach the threshold of 3.2% by the end of the year and 2.5% by the end of 2025.
Chatham Financial expects Euribor to decrease to 3% by early 2025 and 2.7% by the end of next year.
Erste Group, one of the leading financial institutions in Central and Eastern Europe, has a slightly more optimistic Euribor forecast. After the first interest rate cut in June, the lending institution expects Euribor to reach 3% by the end of the year and 2.6% by July 2025.
Most banks and credit institutions’ forecasts for the last months of 2025 are similar. They all expect the three-month Euribor to fall, possibly dropping below 3% after next summer. This suggests easing the ECB‘s restrictive monetary policies in response to lower inflation.
The impact on variable-rate mortgages
Why are Euribor forecasts important for those who have taken out a variable-rate mortgage or intend to do so shortly? Because the mortgage cost varies precisely according to the fluctuations of this value. Therefore, a decrease in Euribor would reduce the monthly mortgage instalments, thus enabling holders of variable-rate mortgages to save money.
In short, the Euribor forecasts suggest that a favourable market phase for variable-rate mortgages is ahead of us after a few years of very steep repayments! As mentioned in the previous paragraphs, this trend is closely linked to ECB policies and global economic conditions. This information is crucial for borrowers to plan their finances better and consider possible switches to fixed-rate mortgages if more stability is desired.
The price forecasts in this article are based on sources believed to be reliable, but do not guarantee the market’s future performance. They do not constitute a recommendation or financial advice. Investing in crypto-assets involves risks, including the potential loss – even total – of the invested capital. Users are required to conduct independent evaluations before making economic and/or investment decisions and to consult their own specialised financial advisor.
In the last few hours, we seem to be reliving the COVID-19 crash of 2020. Could the market restart after central bank intervention, as it did four years ago?
Over the past few days, fear has reigned in the crypto market, which has collapsed along with the stock market. During yesterday’s day, Bitcoin lost more than 15% of its value in less than twenty-four hours, while the NASDAQ and the S&P 500 lost about 5% and 3%.
The week of 9 March 2020, the markets were shaken by a similar event, albeit characterised by a more pronounced bearish movement. At that time, the collapse was caused by the outbreak of the pandemic and the adoption of lockdown measures by most of the world’s countries.
Yesterday’s bearish movement, however, seems to have stemmed from a much broader spectrum of factors: the escalation of the conflictin the Middle East, the Japanese Central Bank’s cut in interest rates, and the consequent collapseof the Nikkei, the country’s main stock market index. Then, the crisis of US technology companies and the fear of an economic recession in the US were accentuated by the latest unemployment figures.
What are the similarities between these two market crashes? Not so much in terms of the causes and price movements that have already taken place as in terms of the possible responses of central banks and the associated price rebound.
Crypto market collapse: key figures
Yesterday’s crypto market crash was the most violent since 2022. The Crypto Total Market Cap, the total market capitalisation of cryptocurrencies, fell to $1.7 trillion at its most critical moment, registering a 15% drop. If we analyse the performance from the end of July onwards, the market capitalisation of the entire sector faced a 30% reduction due to the massive wave of liquidations.
The positions of many traders were forcibly closed, with a monetary counter-value of about $1.07 billion on centralised exchanges. The total value of those swept away on-chain, on DeFi protocols such as Aave or Curve, was around $350 million. Finally, the founding rates for Bitcoin and Ethereum futures turned negative. This means most investors have positioned themselves short and are betting on a further price collapse.
Some have dubbed yesterday, perhaps exaggerating, ‘Black Monday’, a profoundly negative day comparable to those of the pandemic era. Despite this, however, referring purely to the future scenario concerning the crypto market, it may not be the case to despair too much. There are several reasons to be cautiously optimistic about the future. For instance, the price performance of the most important cryptos in recent hours and the possible impact of an early rate cut by the Federal Reserve (FED), which is becoming increasingly likely.
Covid Crash: price movements
To analyse the current scenario, it may be useful to compare the current situation with the crypto market in 2020. At that juncture, in just a few days, the crypto market lost almost 50% of its total value. The crypto total market cap went from $228 billion to $118 billion, the price of Bitcoin went from $8,000 to almost $4,000, and Ethereum went from $270 to less than $100. Similarly, the performance of the stock market was also affected by the arrival of the pandemic. The S&P 500 lost about 35% of its value in less than a month, while the NASDAQ lost 30%.
In the months immediately following, however, the market rebounded strongly, mainly due to the expansive monetary policies adopted by all the major central banks, which we will discuss in the next section. The price of Bitcoin, in the following 52 weeks, recorded +1,400%, or more than a x10. On the other hand, Ethereum rose by +1,500%, rising from $110 to $1,800, reaching its all-time high at $4,700 the following year. It was the same for the stock market, although the movements were much smaller in percentage terms. A year later, the S&P 500 and the NASDAQ almost doubled their value (+89% and +90%). Could we see the same scenario in the coming months?
In short, the ‘Covid Crash’ was a launching pad that allowed all assets to restart strongly after their respective corrections, but what was the petrol that allowed the engines of finance to restart?
The response of the central banks
As mentioned in the introduction, the most exciting part is not the price movements of the main assets but what happened afterward, i.e., the central banks’ response to the situation. This is because the main issues that caused these violent corrections seem similar.
On 12 March 2020, the Governing Council of the ECB (European Central Bank) implemented a package of monetary policy measures aimed at “supporting liquidity and financing conditions for households, businesses and banks and helping to preserve the smooth supply of credit to the real economy”. Then, on 18 March, the European Union announced a massive Quantitative Easing measure, i.e. an unconventional policy action to increase the supply of money in circulation, the Pandemic Emergency Purchase Plan (PEPP). The PEPP injected some EUR 1,850 billion into buying public and private bonds from March to December. Adding this figure to those of the other measures, such as the Targeted Longer-Term Refinancing Operations (TLTRO) and the Asset Purchase Program, launched in September 2019 at the end of the Draghi era, brings the total to almost EUR 3 trillion mobilised by the ECB over three years.
On the other hand, the FED, to stimulate the economy and shelter itself from the risk of recession, immediately cut interest rates, a measure that the ECB could not implement given that European rates had already been zero since 2016. Then, the FED continued with Quantitative Easing policies. It is estimated that the FED injected more than $3 trillion into the economy in the immediate aftermath of the pandemic.
What can happen in the coming weeks?
Is the recent crypto and stock market crash a sign that what happened in 2020 could be repeated in the coming weeks? According to most economists, this is possible since the latest US employment data show that the economy is weakening and the risk of a recession is growing.
Leading macroeconomic experts expect an extraordinary meeting through which interest rates will be reduced, at least as far as the US ‘front’ is concerned. For example, Austan Goolsbee, president of the Chicago Federal Reserve, stated in an interview with CNBC that the Fed is ready to intervene if the US economy deteriorates. The first sign of this came with the latest unemployment figure, which was worse than expected (4.3% instead of 4.1%). Even Elon Musk commented on this, calling the US Central Bank ‘foolish’ for not yet cutting interest rates, as the ECB has already done.
However, the differences from the pandemic period must be noticed too, especially about the size of the crypto world and its degree of adoption. In 2020, the sector’s total value was 10% of today’s, and the world’s most significant investment funds had yet to join this market.
In conclusion, the current macroeconomic scenario is similar to that of 2020. Can the conflict in the Middle East, the ‘recessionary danger’ caused by more than two years of severely restrictive policies, rising unemployment, and the crisis of technology companies compose a sufficiently strong motive to push global economies to reignite?
“Buy the dip” is a phrase often heard in the world of investment and trading, and it’s particularly popular among those active in the crypto market.Let’s take yesterday, Monday, 5 July, as an example: a sort of “Black Monday”. Anyone who didn’t feel queasy witnessing a BTC drop of over 18% must have heard the siren’s call. Dear Odysseus, shall we admit it? Buy the dip, Buy the dip, Buy the dip. This melody has echoed in the ears of those accustomed to the market’s slaps or who have nerves of steel.
The last time we saw such a drop was two years ago. And in every crash, there are two faces: one of catastrophe and one of greatopportunity. But, of course, not all dynamics can be under our control. Solid risk management is needed, as well as building diversified strategies over time to avoid being too exposed to the market. No one wants to be caught in a snowstorm in their underwear, even if we feel like superheroes (and no, don’t do it; it’s a mistake).
After all this preamble, the question is: what exactly is “Buy the dip”? Is it always worth following this “mantra“, or is it better sometimes to be more cautious? In this article, we will try to answer these questions, hoping to give you an extra sword and shield for the next battle. Our wish is that you may emerge victorious.
What does “Buy the Dip” mean?
The literal translation of “Buy the dip” is “buy the drop”. This trading practice involves purchasing an asset after its price has decreased, hoping this dip is temporary and the price will rise again soon. The idea is that the drop represents a buying opportunity at a discounted price, waiting for the market to rebound.
Advantages
Profit opportunities: Buying during a dip can be very profitable if the market rebounds and prices rise.
Average cost reduction: By adding positions during dips, an investor can lower the average purchase cost of an asset, improving the potential return.
Access to discounted prices: Buying assets during a dip offers the chance to acquire them at prices that could be considered discounted relative to their long-term value.
Limitations and Risks
Despite the potential advantages, Buy the Dip also presents significant risks:
No guarantee of rebound: An asset could continue to fall for various reasons, such as changes in economic fundamentals or company management. For example, a crypto that falls from $100 to $60 might seem a bargain, but if the project’s growth prospects are negative, it could drop even further.
Difficulty assessing intrinsic value: It’s often hard to tell if a dip is temporary or a sign of further declines. Buying just because the price has fallen isn’t always a good idea if the reasons for the drop aren’t understood. One must ask: Is the drop due to internal issues or external factors? Is it a temporary situation? Is the project resilient? How long will the price correction last?
Averaging down: If an investor already holds the asset and continues to buy during dips, they are adopting an “averaging down” strategy, which can be risky if the asset continues to lose value. This strategy, if not managed correctly, can lead to significant losses.
Risk management
When adopting Buy the Dip, we need a plan B—an escape route—something to avoid a fatal hemorrhage. What is it? Having a risk management plan. For example, setting a loss limit to avoid being trapped in a prolonged losing position. Some traders set an exit price to control losses. Suppose a crypto falls from $100 to $60, and the trader decides to sell if the price reaches $75 to limit losses.
Context
Buy the dip is often used in different contexts and can have varying probabilities of success depending on the situation.
During an uptrend: Some traders use this strategy when the market is generally rising. Imagine a crypto increasing in value but experiencing a slight drop at some point. Traders who believe in the strength of this uptrend see this dip as an opportunity to buy at a lower price, expecting the price to rise again soon. It’s like taking advantage of sales during a period of high demand.
Without a clear trend: Other traders use Buy the Dip even when there’s no evident uptrend. Here, the bet is that the asset’s current decline will increase. This can happen because they believe in the asset’s fundamentals or the project’s potential behind the crypto. It’s like buying a product at a flea market, hoping its value will increase over time, perhaps due to an improvement, a forthcoming novelty, or because the asset is currently undervalued.
“Buy the Dip” in the crypto market
Buy the Dip is a popular mantra in the crypto market, often promoted by influential traders and investors. However, it is important to remember that the cryptocurrency market is highly volatile, and dips can be significant and prolonged. Nevertheless, this strategy has proven successful when buying the most solid assets in the crypto market, particularly Bitcoin and Ethereum. For this reason, every time these cryptocurrencies drop, the mantra “buy the f****** dip” (BTFD) echoes across social media platforms used by enthusiasts in the sector.
It’s no coincidence that from 4 July, as BTC fell below $60,000 for the second time in four months, posts, tweets, and quotes on “Buy the dip” mushroomed on Reddit, X, 4chan, and Bitcoin Talk.
A well-known example is the 2007-08 financial crisis, where many investors bought shares in companies like Bear Stearns and New Century Mortgage, expecting a recovery that never came. Both companies left the business after losing a significant share of their value. In contrast, those who bought Apple shares after the 2020 crash saw a significant increase in value, making the strategy highly profitable.
The opposite: “Sell the Rally”
The opposite approach to “Buy the Dip” is “Sell the rally”, which involves selling an asset whose price has increased, anticipating an imminent dip. Again, the goal is to maximise profits, but it carries similar risks, such as the possibility of selling too early or too late.
To conclude
“Buy the dip” can be a winning strategy in volatile markets and during long-term uptrends. However, it requires good market knowledge and well-thought-out risk management. It is not a foolproof technique and should not be adopted without a critical assessment of the circumstances and one’s risk profile.
Homework: To avoid being overwhelmed by FOMO, it is useful to remember the opposite mantra. Try repeating: “Time in the market beats timing the market”. This can help you keep a cool head and make more rational decisions.
The cryptocurrency market has been shaken by a significant drop in valuations, with Bitcoin and Ether recording impressive losses. This article will explore the reasons behind this sudden decline, the implications for investors, and the market prospects.
Let’s start by taking a closer look at the Bitcoin crash.
The Bitcoin Crash
On Monday, August 5, 2024, Bitcoin’s value dropped by over 18%, reaching around $51,100, a level it hadn’t touched in several months. Even more drastic was Ether’s fall, which lost 23%, bringing its value to around $2,200. This collapse has wiped out Ether’s entire annual performance.
Behind the Bitcoin Crash: Panic in Traditional Markets
The drop in cryptocurrencies coincided with the dramatic collapse of Asian markets. The Bank of Japan’sdecision to raise interest rates to the highest level in 16 years shook the markets. Panic began to spread at the end of the previous week, during the weekend of August 3 and 4, and peaked on the night between August 4 and 5. One indicator of this fear was a significant drop in the Nikkei index, one of Japan’s leading stock indices.
The Nikkei 225 closed with aloss of 12.4%, the worst session since “Black Monday” in 1987. The Topix followed the same fate, dropping by 12.23%.
Carry Trade and the Japanese Yen
One reason for this concern is related to an investment strategy called carry trade, which investors use to exploit low interest rates in Japan. Here’s how it works:
Borrow at low cost: investors borrow money in Japan, where interest rates are meagre (almost zero).
Convert and invest elsewhere: investors convert the borrowed money (in Japanese yen, JPY) into another currency, such as the US dollar (USD).
Buy stocks: with these dollars, they buy stocks of technology companies in the US stock market, like those in the Nasdaq 100 (an index that includes large tech companies).
Effects of the Carry Trade
When many investors engage in this:
The yen depreciates: converting large amounts of yen into dollars causes the yen’s value to fall.
The Nasdaq rises: purchasing many American stocks causes their value to increase.
Current Problem
The Bank of Japan recently raised interest rates, increasing the yen’s value. When the yen’s value rises, investors who borrowed yen must repay more in other currencies, making carry trade less convenient. In recent days, many investors have abruptly stopped engaging in carry trade.
Result
Markets panic: By stopping the carry trade, investors sell the stocks they had bought (like those in the Nasdaq 100), causing their value to fall.
Nikkei Index drops: The sale of stocks and general uncertainty cause significant market drops, as seen in the Japanese Nikkei.
In summary, the market panic was caused by the end of an investment strategy (carry trade) that no longer works well due to changes in interest rates in Japan. This led to massive stock sales and significant market declines, affecting American stocks. Let’s now look at the impact in figures.
Impacts on US Markets
The first to suffer from the “panic-sell” were tech companies. Here’s how their valuations plummeted:
Apple: -6%
Meta: -10%
Microsoft: -12%
Amazon: -17%
Adobe: -18%
Nvidia: -20%
Broadcom: -23%
Tesla: -25%
Qualcomm: -30%
AMD: -37%
The Nasdaq dropped 3.4% last week, marking the worst three weeks since September 2022. Currently, futures indicate a further decline of the Nasdaq by 5%, with the S&P 500 and the Dow Jones down by 2.6% and 1.12%, respectively. The CBOE volatility index, often called the market fear gauge, rose by 58.7%, reaching its highest level since 2020.
Why Tech Companies?
We can outline three reasons:
Warren Buffett, the famous American investor, has sold half his stake in Apple for $76 billion, causing a significant shake-up in the sector.
Intel, one of the largest semiconductor companies, has announced a major personnel reduction, with the layoff of 15,000 employees.
Many prominent American companies reported disappointing quarterly results, below analysts’ expectations. This caused a significant crash in the tech sector’s stock market. After mass layoffs post-pandemic, tech companies became very popular again due to the excitement for artificial intelligence (AI).
Problems with Artificial Intelligence (AI)
However, AI has not proven as reliable as hoped:
Profit doubts: experts and analysts from Goldman Sachs have raised doubts about AI’s ability to generate good profits compared to more traditional projects.
High costs: the enormous investments required to develop AI must yield the expected returns.
Market Effects
These issues have led to:
Stock sales: investors started selling tech company stocks.
Stock decline: even companies that met their targets saw a decrease in their stock value.
Disillusionment: there is growing disappointment among investors about AI’s promises.
The combination of disappointing financial results and concerns about AI’s profitability caused a wave of sales in the tech sector, increasing uncertainty in global financial markets.
In similar scenarios, fear has a chain reaction. It leads investors to get rid of higher-risk assets, like cryptocurrencies immediately. Let’s see the consequences of the last domino falling: the crypto market.
The Impact of the Crash In Figures
Total Cryptocurrency Market Capitalization (TCMC)
Since August 2, the cryptocurrency market capitalisation has collapsed by $510 billion in just three days. This collapse involved more investors than in the past, thanks to the approval of spot ETFs on Bitcoin and Ether, which attracted many institutional investors.
Market Crash and Leveraged Long Positions
The sudden crypto market crash wiped out over $600 million in leveraged long positions. According to TradingView data, on August 5, the BTC price dropped to around $49,000 before recovering to $52,900. ETH also experienced a significant drop, falling from $2,695 to $2,118 over the same period.
Impact on Ether Traders
In recent months, there has been a significant increase in open interest in Ether, with traders flocking to gain exposure to the asset ahead of the approval of Ether spot ETFs in the US. However, the sharp drop in cryptocurrencies hit hard, and traders seeking leveraged exposure to Ether, with over $256 million in long positions, liquidated.
Josh Gilbert, a market analyst at eToro, stated that cryptocurrencies are often an indicator of investor sentiment. When investors panic or seek to reduce leverage, cryptocurrencies are often the first asset to suffer the consequences. However, Gilbert shared an optimistic outlook for cryptocurrencies in the coming months, suggesting that investors might see this situation as an opportunity.
The Economic Scenario
To comprehend this swift decline in the Bitcoin crash, it is crucial to broaden the perspective and examine the underlying beliefs rather than solely the reasons for the downfall. Let’s analyse the conducive environment that transformed uncertainty into widespread panic.
Are the United States Entering a Recession?
Recent economic indicators in the US and many analysts suggest the economy will enter a recession early next year. Recession fears negatively impact the markets, and market participants speculate on potential actions by the Federal Reserve.
Unemployment Data Is Not Positive
The monthly report from the US Department of Labor showed a growth of 114,000 jobs in July, well below the forecast of 185,000. The unemployment rate rose from 4.1% to 4.3%, the highest since October 2021. These harmful economic data create a growing sense of alert about a weakening job market and the economy’s susceptibility to recession.
Fed Interest Rates
For a year, the US Federal Reserve has kept the benchmark borrowing costs at a 23-year peak of 5.25%-5.50%. Some analysts fear that this prolonged restrictive monetary policy could push the economy towards a recession. The Sahm Rule recession indicator, which exceeded the 0.50 threshold, has historically signalled the early stages of a recession in the US economy.
While significant data are expected before the September 18 meeting, an acceleration in employment trends in August could strengthen the case for a 50-basis-point cut. However, currently, consensus leans towards a 25-basis-point reduction.
Expert Opinions
Simon White, a Bloomberg rate strategist, notes that the market might be prematurely anticipating a recession that is unlikely to occur before next year at the earliest. He adds that while the Sahm Rule triggers heightened recession concerns, it is often delayed and does not capture many stock downturns, making it neither a necessary nor sufficient condition for a recession.
Brian Jacobsen, chief economist at Annex Wealth Management, expressed concerns, stating that the Fed is on the verge of turning a victory into a loss. According to him, the economic momentum has slowed to the point that a rate cut in September might be insufficient and that a more substantial reduction than the typical quarter-point cut might be necessary to prevent a recession.
Trump’s Support for Bitcoin
Considering Donald Trump’s clear stance on Bitcoin, the upcoming US presidential elections could significantly impact the cryptocurrency market. During the recent Bitcoin Conference in Nashville, Trump compared Bitcoin to the steel industry a hundred years ago, arguing that blockchain has the potential to shape the future of the global economy.
However, current polls show a recovery for Kamala Harris nationally and in three key electoral college states: Michigan, Wisconsin, and Pennsylvania. Although the margins are skinny and fall within the statistical error, especially in Pennsylvania, some models give the Vice President slightly better odds than Trump for the final victory. Just a few days ago, this scenario seemed highly unlikely.
From Certainty to Prospect
As a result, the situation that had helped push Bitcoin’s value so high has changed. Trump’s re-election now appears much less inevitable than two weeks ago, making a possible shift in cryptocurrency use in the United States only a prospect. This uncertainty adds to financial and international market concerns, with the Middle East teetering due to rising tensions between Israel and Iran. Unfavourable polls for Trump created the perfect scenario for a Bitcoin crash.
Future Prospects
The recent cryptocurrency market crash, especially the Bitcoin crash,has highlighted their vulnerability to macroeconomic events and political decisions. However, it is essential to remember that fundamental factors, such as the approval of ETFsand Bitcoin’shalving, have yet to show their full long-term impact. These events could potentially lead to a recovery and significant growth in the future.
Despite risk signals, it is essential to note that analysts have rarely successfully predicted a recession with accuracy. Economic forecasts are inherently uncertain and often subject to sudden changes. Moreover, during bull markets, the cryptocurrency market tends to decouple from the stock market, potentially offering different opportunities to investors.
In conclusion, while the cryptocurrency market is experiencing a difficult phase, its long-term prospects remain interesting. Investors need to maintain a long-term view and consider the risks and opportunities this dynamic market offers.
To follow these and other real-time news and check crypto market prices, sign up for Young Platform.
Grayscale has just announced its crypto AI fund. Find out what this innovative financial instrument consists of.
Grayscale has just announced its Decentralised AI Fund LLC. This brand-new investment fund will allow those who purchase it to gain exposure to the most important crypto protocols aiming to establish themselves in the artificial intelligence sector.
What cryptos does this innovative fund consist of? What is Grayscale’s main goal, and what artificial intelligence problems could blockchain solve? Find out in this article.
Practically everyone knows Grayscale, mainly because it is the largest native crypto investment fund, the first to launch financial instruments on Ethereum and Bitcoin. For this reason, the news released in the past few hours is essential, given the ability of the team of this cutting-edge financial player to intercept new trends.
The main problem with artificial intelligence, at least according to Grayscale, concerns the centralisation of the companies that control it.
Few and far between are those who can offer products that can reach the masses, mainly due to the enormous amount of data they hold. As a solution to this problem, various decentralised AI protocols have emerged, aiming to make their processes even more innovative and intelligent. In particular, blockchain technology makes it possible to distribute the ownership and governance of AI services, thereby increasing transparency.
The cryptocurrencies that make up
For now, the information at our disposal tells us that The Grayscale Decentralised AI Fund will self-rebalance every quarter and will accommodate the following basket of cryptocurrencies:
The team has yet to comment on possible future additions, but other cryptos will likely be added over time. Why did Grayscale choose these? Well, because they represent the three main categories of crypto AI around today:
Protocols that are building decentralised artificial intelligence services;
Projects that seek to solve the main problems encountered by AI platforms;
Infrastructure networks and resources required for technology development. For example, decentralised marketplaces for data storage, or those for exchanging GPU computing power and graphics rendering.
To conclude, we can quote the words of Rayhaneh Sharif-Askary, Head of Product & Research at Grayscale, who was mentioned in the press release through which the announcement was made. “The rise of these disruptive technologies has created exciting opportunities for investors, and we believe our crypto AI fund is a great way to invest in this emerging sector. Blockchain-based AI protocols embody the principles of decentralisation, accessibility and transparency and can potentially mitigate the fundamental risks emerging from the proliferation of this technology.”
Artificial intelligence is also conquering the Web3. What is crypto AI, and what innovations will it introduce?
The fusion of blockchain technology and artificial intelligence is now much more than a trend, primarily since the launch of Chat GPT and other similar services, i.e. since its potential was understood. Less than two years later, many of us use these types of services daily, even if there is a feeling that the current scenario is only the tip of the iceberg.
AI and cryptocurrencies will most likely become increasingly part of our lives. But can these two technologies work together, and, more importantly, why should they?
Artificial intelligence has been the keytechnology of the past two years, and cryptocurrencies and blockchain achieved supremacy, at least in part, during the bull run 2021. The big difference in adoption between these two technologies concerns the user experience, as the currently available examples of AI models are easier to use than blockchain protocols and decentralised applications. However, huge strides have been made in this regard in recent years.
However, the two key technologies of this decade can collaborate, and the crypto AI protocols that have emerged in recent months offer valuable support for this thesis. The convergence of blockchain and artificial intelligence became mainstream when ChatGPT was released. OpenAI’s chatbot was designed to interact with users like in a normal chat conversation with which everyone is familiar. On the other hand, the final consecration came in recent months after the staggering performance of Nvidia’s stock, which was, albeit briefly, the world’s largest company.
Since then, many crypto AI projects have sprung up, while existing ones have attracted attention. Moreover, some key protocols have intercepted and exploited the situation by reorganising and modifying their vision in a manner consistent with the needs of this new market segment. For instance, Filecoin has ridden the hype wave on artificial intelligence by offering itself as a storage service provider for emerging AI companies. Or Near, which is harnessing its large roster of developers to create decentralised, self-modifying AI based on user behaviour.
In short, these technologies can coexist; indeed, it is likely that they will. According to Alexander Good, author and respected Key Opinion Leader (KOL), the capitalisation of crypto AI could reach $2 trillion in the next few years, while Grayscale, the world’s largest crypto investment fund, has just launched its exclusive financial product for this sub-sector.
Decentralised AI models: what problems do they solve?
We can start with a technical assumption to answer the question posed in the subtitle, but don’t worry, nothing too complex. Blockchain and AI models feed off the same power source: computing power. In the same way that miners use powerful machines made up of video cards (GPUs) connected in series, the same computing power is used to train artificial intelligence models to make them increasingly accurate and thus useful. In this sense, crypto AI projects such as Render (RNDR) or Bittensor (TAO) deal with tokenising computing power that can then be exchanged and used by network users. Thanks to this possibility, AI models can become more accessible and decentralised. The immense power of artificial intelligence is, today, concentrated in the hands of large and prosperous companies that own the supercomputers needed to ‘run’ them.
The decentralisation discourse also applies to data indexing, i.e., the process of organising and returning data to users that ‘Chat GPT-style’ chatbots and search engines constantly perform. For instance, a protocol such as The Graph takes on-chain data and organises it, making it readable to users, all decentralised. It also uses Semiotic AI to automate searches within its data containers.
Let us now take a look at the main three objectives of the crypto AI segment and the projects related to them:
Building decentralised artificial intelligence services and facilitating user access: In this respect, the main project to watch out for is the Bittensor (TAO) mentioned above, a centralised machine learning platform with more than 90,000 users. Through Bittensor, particularly its sub-networks, it is possible to generate texts, translations, and images that are very precise regarding the prompts you enter. In short, it is a fully decentralised GPT Chat with an internal economy that rewards users who secure it and those who use it.
Solving the main problems encountered by AI platforms, such as the authenticity of information and deep fakes (fictitious videos or photos in which the image of a public figure appears). In this sense, crypto AI projects can exploit the key features of blockchain technology, particularly its decentralised nature, transparency, and immutability, to protect users from these threats.
Managing the infrastructure networks and resources required for technology development, particularly storage and GPU computing power. In this sense, the projects that stand out are Filecoin (FIL) and Render (RNDR). As already mentioned, the former allows users to store data through a centralised peer-to-peer cloud-based architecture. This is a perfect solution for emerging artificial intelligence companies.
Render, on the other hand, thanks to its decentralised marketplace for graphics rendering, allows anyone who wants to access the service, whether designers or artificial intelligence models, to do so without having to buy expensive equipment.
Crypto AI: our thematic Moneybox
Now that you know all the main applications of crypto AI and the problems they solve, you just have to discover our new ‘Artificial Intelligence’ Moneybox. We, like Grayscale, intend to enable our clients to gain exposure to this promising sector.
Our Crypto AI cocktail consists of three delicious ingredients: Render (RNDR), The Graph (GRT) and Near (NEAR).
Young Platform’s crypto Moneybox is a separate wallet from the one you normally use to store your cryptocurrencies. It is used to set aside your favourite cryptocurrencies for the long term, avoiding spending them on everyday or frequent transactions. Of course, you also have the option to ‘put your own spin on it’ by creating a Customised Moneybox and choosing up to five cryptos to include and the percentage to distribute on each.
If you want to learn about this functionality, you can consult the guide about Moneyboxes functionality.
Biden has officially withdrawn from the US presidential election race. What happens now? What impact has the news had on the market?
This week started with a very important piece of news: Joe Biden, the current president of the United States, has announced that he will not runin the nextUS elections. According to him, he will “focus on finishing the current term as best he can.”
The diplomatic tones of the announcement are not enough to hide the truth. Joe Biden is retiring because of bad public appearances in recent years and strong pressure from the Democratic Party, which considers him no longer up to the electoral battle due to health problems. Read more in the article.
Biden resigns: Kamala Harris in his place?
“Biden launches Kamala Harris” headlined the New York Times after the news, also given the post on X (formerly Twitter) immediately following the withdrawal letter in which the president announced his full support for his deputy. The announcement came during the day yesterday, shortly after two o’clock in the afternoon, in American time (East Coast time).
It must be specified, however, that Biden did not resign as President of the United States, an action that would have made life much easier for Harris. Had it gone this way, the transition of the leading Dem in the US elections would have been much easier. The main problem with this is that Biden won the primaries and, therefore, there are delegates associated with his name who should have confirmed his nomination as the nominee at the Democratic convention in Chicago. As he did, Biden can only suggest, not dictate, that these vote for Kamala Harris. The fear of an ‘open’ convention, i.e., multiple candidates vying for the vote not of the voters but of the delegates indicated by the primaries in the past months, has been at the centre of much political analysis in recent weeks.
Predictably, after Biden’s announcement, the candidates’ odds of winning also changed. Before the announcement, the poll by Polymarket, the most popular decentralised prediction app, gave Trump a 71% win and Biden a 16% win. However, Donald Trump’s odds of winning have dropped to 64%, and Kamala Harris’s are at 30%.
A short while ago, we witnessed the opening of the US stock market, which performed very well in the first few minutes of trading after Biden’s departure. The NASDAQ 100, the index that tracks the performance of the hundred most capitalised technology companies, recorded +1.56%, and the S&P 500, +1%. However, the impact of Biden’s withdrawal onBitcoinwas visible from the minutes immediately following the announcement. BTC returned above $68,000, if only for a few hours.
What will happen in the crypto world if Trump wins the November election? In recent months, the entrepreneur and former president has been increasingly pro-crypto. After several pro-BTC statements, the most important news concerns his presence at Bitcoin 2024, the world’s largest conference dedicated to the crypto world scheduled for 22-25 July in Nashville.
However, there is more; a Trump re-election could also cause an injection of liquidity in the ‘traditional’ markets, especially the stock market. His first term was already characterised by expansionary economic policies aimed at stimulating the economy, which could be applied again, given the recent slowdown in inflation. Will his very likely victory in the November 2024 elections signal the start of the most explosive bull run ever?
What are the most widely used Ethereum Layer 2s? Here’s who is winning the race to speed up and reduce transaction costs
What are the most widely used Ethereum Layer 2s? These protocols aim to provide faster and cheaper transactions than the main blockchain. The urgent scalability challenge for the ‘world computer’ is played out in transactions per second (tps) and Total Value Locked (TVL). The first metric measures how many transactions a protocol can handle per second, and the second is the total value of locked cryptocurrencies and, thus, the available liquidity. This value is used to assess a project’s spread.
Ethereum’s main Layer 2s (excluding Polygon, a real blockchain) differ in the scalability technology used: zero-knowledge rollup, optimistic rollup, Validium, or Plasma. Each determines trade-offs between speed, security, and cost. For example, Arbitrum is considered the best solution for developers, Optimism is the most compatible with Ethereum, and zkSync is unbeatable in terms of security.
Here is the ranking of the most used Ethereum Layer 2s!
Layer 2 Ethereum: Arbitrum in focus
Arbitrum is at the top of the list of the most used Ethereum Layer 2s, a protocol that uses optimistic rollups. You can find NFT marketplaces, play-to-earn games, and stablecoins in its vast ecosystem. It is also supported by the most important decentralised finance dapps, such as Uniswap, Aave, and Balancer.
Regarding numbers, Arbitrum has an LTV of $16 billion, can theoretically process a maximum of 1,500 transactions per second, and the commission to send ETH costs $0.05 on average.
Several decentralised applications have sprung up on Arbitrum that have dominated the DeFi landscape since the bear market in 2022, notably GMX and Pendle. The ARB token was distributed via airdrop to users who interacted with the blockchain months before its release.
And continuing to talk about the more popular Layer 2s, another scaling solution is Optimism, which, as its name implies, also exploits optimistic rollups. This protocol is known for being integrated with the mother blockchain, so much so that it is said, ‘if it works on Ethereum, it also works on Optimism but at a fraction of the cost’, and for having open source code available to programmers. Synthetix, one of the most popular trading platforms, is developed on it; the network also promised a series of airdrops for its most active users.
Optimism’s LTV is $7 billion, it processes about 2,000 tips, and the average commission per transaction is $0.03.
Base
The blockchain developed by Coinbase, one of the most popular centralised exchanges on the market and the only one listed, has exploded in recent months. The reason? Mainly meme coins. Yes, you got that right. Cryptos born ‘for fun’ have increased the popularity of this Layer 2 incredibly.
The total value locked up within Base is currently USD 5.4 billion; at the beginning of March, it was less than a third!
Blast
The fourth Ethereum Layer 2 for TVL today is Blast, a recently born project that has managed to attract more than USD 2.5 billion in liquidity quickly. This sudden popularity is attributable to the aggressive marketing campaign undertaken in recent months. Blast, in fact, announced an airdrop before the launch of its blockchain, thus attracting all users who wanted to receive that free distribution of tokens.
This Ethereum Layer 2 has not yet released its governance token, which will arrive soon. To increase your chances of receiving it, you can buy ETH on the Young Platform, withdraw funds on the Ethereum network, and use a bridge to reach the network.
Returning to the subject of Ethereum layer 2 whose development is managed by the foundations of decentralised exchanges, we cannot fail to mention Mantle. The fifth scaling solution for Ethereum for TVL, which stands at around USD 1.2 billion, is developed by BitDAO, the autonomous and decentralised organisation launched by ByBit.
Starknet
A Layer 2 of the Starkware Industries ecosystem specialising in cryptography. Starknet runs on zero knowledge rollups and STARK Proof. Its LTV is $63 million, and commissions are $0.09.
zkSync Era
In seventh place in the most used and popular Ethereum Layer 2s ranking is zkSync Era. This protocol is based on zero-knowledge technology and aims to scale Ethereum while maintaining its decentralisation. It has over 500,000 active users and supports all projects on the core network without code changes.
The TVL of zkSync Era is $521 million, and the fee for transferring ETH is$0.09.
Manta
Manta is a multi-modular Layer 2 consisting of two networks utilising zero-knowledge rollup technology. Manta’s story began with Atlantic, a fast Layer 1 network built on Polkadot, and continued with Pacific, a highly scalable EVM-compatible Layer 2 network.
Manta Pacific’s LTV is currently $795 million, which is why it ranks eighth among the most used Ethereum Layer 2s.
Line
Linea is a Layer 2 blockchain developed by Consensys, the web3 company that developed the crypto wallet Metamask. This is also why this project has raised huge capital through several funding rounds, some USD 725 million.
Linea’s current LTV is $780 million.
dYdX
The ranking of the most widely used Ethereum Layer 2s continues with dYdX, which, unlike the previous projects, is a truly decentralised exchange with an LTV of 335 million.
Metis Andromeda
Metis Andromeda is another Layer 2 compatible Ethereum Virtual Machine, born from a fork of Optimism. This protocol is currently the cheapest, with transaction fees less than $0.01. Its Total Value Locked is 94.26 million.
Loopring
In sixth place in the ranking of the most used Ethereum Layer 2s is Loopring, an emerging DeFi project based on zero-knowledge cryptography. It processes over 2,000 tps, has a blocked value of 101 million and costs around $0.02 per transaction.
Immutable X
Known primarily as a decentralised gaming network, Immutable X exploits StarkEx’s Validum technology (zero knowledge) to make play-to-earn faster and cheaper. A total of USD 187 million has been blocked on this Layer 2.
Polygon zkEVM
The ranking ends with Polygon zkEVM. Perhaps the project par excellence that has spread the ‘zero knowledge’ trend in crypto communities. It is also one of the most recent protocols launched last March 2023. Polygon zkEVM has a blocked value of 38.03 million. The fees for a transaction amount to $0.03.
Looking at the ranking of the most popular and widely used Ethereum Layer 2s, it is clear that with these numbers, one can already speak of mass adoption. Scalability remains the real goal on which crypto projects are working relentlessly. Among the upcoming releases to watch is Scroll (currently under testnet), especially for possible airdrops.
Let’s summarise the Q2 2024 YNG token report. What happened in this news-packed quarter? What are the following steps to be taken?
What happened in the last quarter? What were all the targets achieved in Q2 2024? How many tokens were issued, bought and sold, and what are the next steps? A complete overview in this report, compiled in July 2024.
The numbers of Young Platform Clubs in Q1 2024
YNG is Young Platform’s utility token, which grants access to Clubs the subscription plans that offer exclusive benefits dedicated to our biggest supporters.
The clubs currently consist of 1,699 people, divided into:
1256 for the Bronze Club
195 for the Silver Club
123 for the Gold Club
125 for the Platinum Club
To join a Club, a certain amount of YNG must be blocked on the Young Platform exchange. Therefore, the number of registered members is essential for analysing the distribution of the token, especially since the more people join a Club, the lower the selling pressure on YNG will be. The main consequence? A more stable price of YNG.
If we compare these figures with those of the past, Q2 2024 was flat from the point of view of Young Platform Club adoption. At the end of Q1 2024, there were 1,687 members, divided into:
1238 for the Bronze Club
199 for the Silver Club
122 for the Gold Club
128 for the Platinum Club
As a result, club membership has remained virtually the same, with a weak growth rate of around 0.7%. However, given the market performance of the past months, we can be quite optimistic for the near future. Despite the general bearish movement, which, as anticipated, also affected YNG, the number of members in the Clubs has, albeit slightly, grown.
Distribution of the YNG token
The number of YNG in circulation in April was about 23.5 million. The circulating supply in July was about 23.6 million, meaning a net increase of about 78,449 tokens or 0.33%.
These tokens were distributed via the Young Platform Step app in different ways:
19,473 through the completion of Quizzes, Challenges and Up&Down (before the implementation of the levels).
58,975 through the completion of the Levels.
The YNG token market is managed via an algorithm defining the exchange rate through two underlying liquidity pools, EUR and YNG. At launch in May 2022, these pools contained:
1 million
4 million YNG
Considering the sales and purchases of tokens handled in recent months, as of July 2024, the pools contain:
669,000 Euro
6.32 million YNG
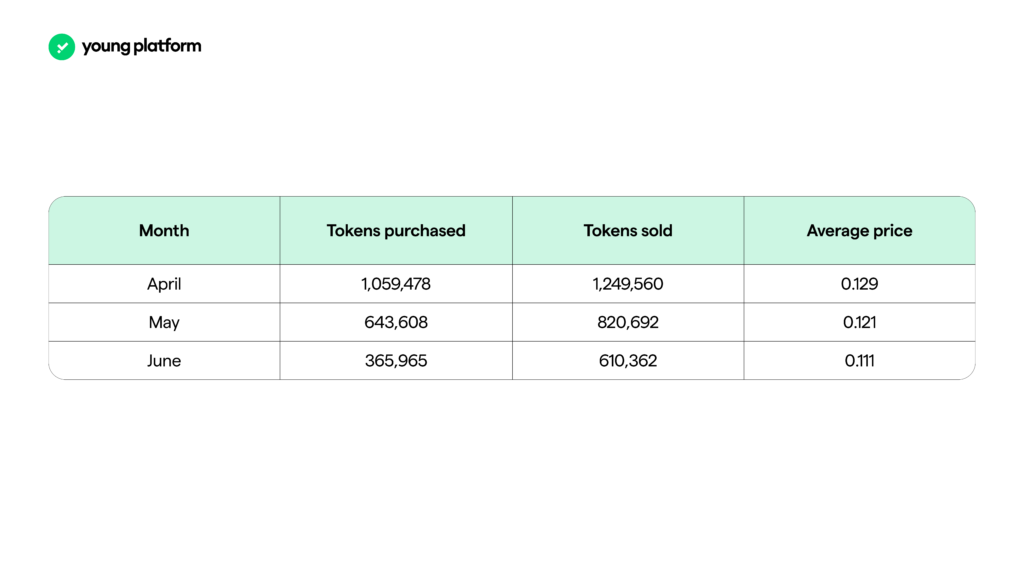
This configuration is the result of purchases and sales during the third quarter, summarised below together with the price trend:
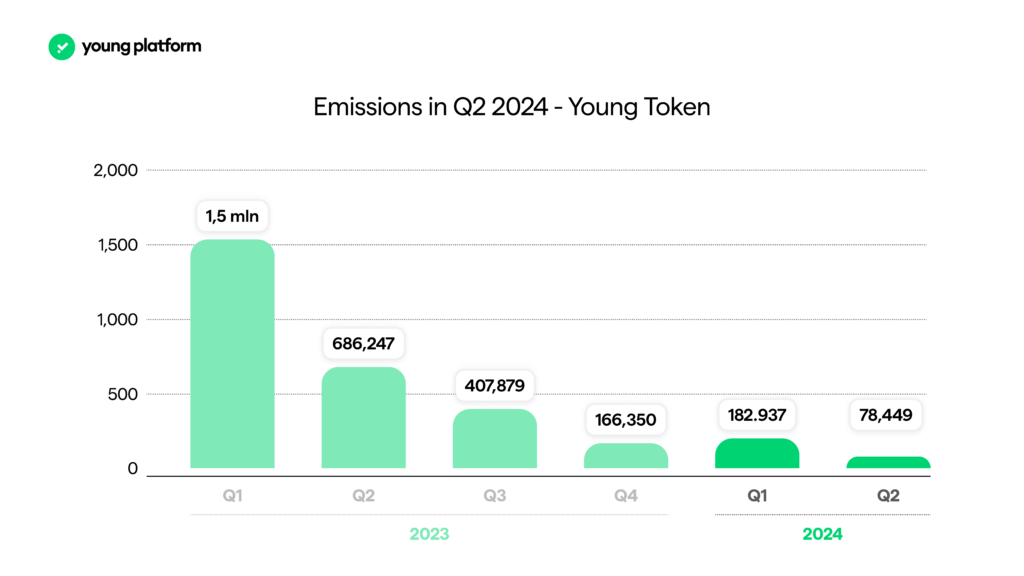
YNG’s emissions in 2023
What happened during the second quarter of 2024 from the point of view of tokenomics? How the token is issued changed last year after the 3.0 Step update. Now that a bit of history is available let us see how the introduction of XPs aimed at limiting YNG inflation has affected it.
As can be seen from the graph, thanks to the latest Step update, we were able to severely limit thedistribution of YNG. The issuance of new tokens was reduced by 95%, and a reduction in active users also caused this effect.
The price of YNG
In terms of price action, the second quarter of 2024 was in line with the crypto market’s performance.
The YNG token in the first quarter of 2024, also thanks to the launch of the new Smart Trades feature, rose from the €0.10 level to the €0.13 level. In the following months, however, thanks to the retracement of most cryptocurrencies on the market, it returned to support in the €0.10 area. However, from the beginning of July onwards, it seems to have regained some strength.
The main catalyst that could bring YNG back to the vicinity of the resistance that rejected it during April is the launch of the decentralised market, scheduled for the coming months. The following paragraphs provide all the details on this issue.
Targets achieved in the second quarter of 2024
During Q2 2024, we mainly focused on taxation, mainly because the deadline for declaring cryptocurrencies was 30 June 2024. In addition, we carried out all the necessary activities to comply with the European crypto regulation, Market in Crypto Assets (MiCA), which partially came into force at the end of June. This report is an excellent excuse to summarise the work done over the last three months. Let’s look in detail first at all the steps taken in 2024 to increase the attractiveness of our YNG token.
The Fees and Reports Functionality
The central topic of Q2 2024 was the crypto declaration. Compared to previous years, mainly due to the Agenzia delle Entrate, circular 30E and the Italian Legge di Bilancio for 2023, the obligation to declare one’s crypto was explicitly highlighted. Mainly due to two issues, as the documents mentioned above state:
Meet regulatory requirements for combating money laundering and terrorist financing.
Determine the taxes due based on the potential income generated.
How did we enable our users to comply with the latest regulations as easily and intuitively as possible? Above all, how have we tried to make ourYNGtokenmorecentral, also regarding this issue?
The flagship feature, revamped from 2023, is the Tax Report. This time, however, it has been placed within a larger section, which we have decided to call ‘Taxes and Reports‘, built to become the only medicine needed against the declaration ‘headache’, and consists of these services:
The Young Platform Tax Report was updated for the 2024 declaration – valid for the income declaration in Italy.
The Tax Report Integrated with Okipo (exchange, wallet and third blockchain) – valid for the declaration of income in Italy.
The Young Platform Transaction Report
Stamp duty
The consultancy service with our accountants – valid service for the declaration of income in Italy.
To ensure the best possible experience for members of the Young Platform Clubs, populated by our most loyal supporters, we applied graduated discounts for each service in the ‘Fees & Reports’ section.
The following discounts have been applied to the Tax Report, consisting of a practical PDF with a clear and simple outline of all the cryptos you own and the data you need to fill in your tax return, including the facsimiles of Form RW and Form RT, compared to the starting price of €29
Club Bronze: 10%.
Club Silver: 20%.
Club Gold: 40%.
Platinum Club: 80%.
The same percentages were also applied to Okipo’s Integrated Report. This document is designed for Young Platform users who also use other exchanges, own NFTs, have cryptocurrencies on DeFi platforms or simply store their crypto-assets on wallets outside of Young Platform:
Club Bronze: €54 (instead of €229 per fiscal year).
Club Silver: €49 (instead of €229 per fiscal year).
Club Gold: €44 (instead of €229 per fiscal year).
Platinum Club: €39 (instead of €229 per fiscal year).
Listing of the Young Token (YNG)
Some of the most interesting news, as far as the last quarter is concerned, concerns our YNG token. In contrast to what we wrote in the previous report, where we assumed that we would start trading on decentralised exchanges by the end of the third quarter of 2024, the set-up has changed slightly.
First of all, we have decided to place this activity within the evolution process of our products, the main points of which you will find at the end of this Report. In addition, we intend to include, before the opening of the Liquidity Pools, two sales phases (one private and one public). There are three main reasons for this decision:
strengthen YNG’s liquidity;
increase the budget to support the project (to be allocated mainly to development and marketing in order to achieve the ambitious internal goals we have set ourselves);
maximize interest around the event: in this way, we expect to be able to reach a wider audience of crypto users who are active in the decentralised market but are not yet familiar with our ecosystem.
In any case, the work that will allow us to expand into the decentralised market has officially begun, after the company’s management approved the operational plan. This foresees YNG landing on the decentralised exchange (DEX) by the end of 2024.
In addition, we have started to dialogue with several decentralised blockchain protocols, specifically some Layer 2s of Ethereum. This activity has several objectives. First of all, it aims to identify the ecosystem that best matches our principlesand values since we want to open the pools on at least one other blockchain besides Ethereum, where the deployment of YNG took place. We also need to define, together with the stakeholders, the incentive programme for those who will use our token.
In the first few days after the ‘green light’, we worked on the necessary documentation to tackle the next steps, which we will present to the Platinum Channel members of our Discord server in the coming weeks. If you are a club member but are not yet in the dedicated channel, join and check your mail. You should have received a form!
As already mentioned, work on the ‘token project’ is being carried out in a manner consistent with that on the corporate roadmap, as we intend to make YNG increasingly central within our ecosystem. As was already the case with the Smart Trades feature, in fact, each new feature will introduce new benefits for club members, incentivising users who are not members to join.
Discord Leaderboard
The first round of prizes for Discord users is on its way! These days, we are collecting all the necessary data to send out the prizes at the beginning of September.
If you are registered on Young Platform, you should have received a notice about it. For those who don’t know what it is, it is the Young Platform community’s common space where you can exchange opinions and thoughts about your journey in the crypto world.
OK, but what is the communication for? Within the server, there is a leaderboard in which members are ranked according to the XP (experience points) they have earned through their activity. In order to reward the most active members, however, we need to link their username to their Young Platform account. If you are not yet part of this exciting group, you have to join! After all, an adventure becomes much more exciting when shared.
Now ‘comes the good stuff’ and even some spoilers.
As anticipated, during the second quarter of 2024, we focused a lot on the fiscal and regulatory aspects of our industry, given the various deadlines that were looming. At the same time, however, we were also able to plan for the future, setting new and ambitious goals for the coming ones. Check out the main ones.
Staking, we’re almost there!
At the end of June, the European Securities and Markets Authority (ESMA), the body that regulates financial markets and instruments for the European Union, commented on this issue by publishing a Q&A on its official website. One of the questions in the document concerned staking, specifically whether or not MiCA prohibits such activity. ESMA’s answer was quite clear: MICA does not prohibit staking and does not assume that a licence is required to offer it, provided that those providing the service, the so-called crypto-asset service providers (CASPs), act in a manner compliant with the regulations and are liable to their clients for any loss of crypto-assets attributable to them.
For this reason, we immediately set to work on integrating this service along with the ever-present benefits for our Club members, due out by the end of Q3 2024.
As many of you may have noticed, we are gathering your feedback and opinions through a form and one-to-one interviews to decide our next big innovation. Your ideas are crucial in shaping our future.
We have something special in the works, a project that has been part of our plans for a long time. Recently, we decided to take it up again, thanks to new opportunities that allow us to think big.
Imagine a novelty that allows you to combine the best of traditional and digital worlds, a feature that does not merely offer a simple tool but aims to transform your daily experience into something revolutionary. We want to differentiate ourselves from our competitors and create something unique, not just an accessory but a valid extension of our ecosystem.
We aim to launch this novelty by the end of the first quarter 2025. We are working on various ideas to reward our Club members and further enhance the YNG token, perhaps with incentives to increase your engagement and rewards.
Communication to Young Platform Users Regarding MiCA Regulation and USD Coin
Following our communication on June 29, we want to update you on the compliance of stablecoins on Young Platform concerning the MiCA Regulation.
USDC Stablecoin Compliance
We are pleased to inform you that the USDC stablecoin is now fully compliant with the MiCA Regulation. The USDC and EURC White Papers, available here, provide further details.
As of 1 July 2024, USDC will be issued as an EMT (Electronic Money Token) under Article 3 of the MiCA Regulation. USDC will remain available on the Young Platform without interruptions or modifications.
Official Website: Take a look at the Circle and USDC websites.
For all information requests and subpoenas from law enforcement, send an email to [email protected].
Updates on Other Stablecoins
Regarding the other token (USDT, PAX Gold, and DAI), we await official communications from their respective issuers about their compliance with MiCA. In the meantime, Young Platform has taken the following measures to ensure compliance with the new European regulation:
Continuous monitoring of official communications from the issuers.
Timely updates to users regarding any news on the compliance of the stablecoins.
We will keep you informed with a new communication shortly about the next steps regarding these stablecoins.
Thank you for your attention, and please stay tuned for further updates.