Donald Trump has announced tariffs on a large number of countries. How much are they, and how have they been calculated? Spoiler: bad
Donald Trump’s announcement of duties on Tuesday sent shockwaves through various groups: politicians, citizens, companies, and especially the markets. Specific points were particularly emphasised. One notable aspect is the range of countries targeted by the US president’s decision—nearly all countries, including an island in Australia home only to penguins, except Russia, Cuba, North Korea, and Belarus.
However, the most intriguing aspect of this sovereignist, anti-globalisation decision is how the duties were calculated. This article will explore this aspect in greater detail.
A wave of global tariffs
The Trump administration’s trade offensive includes additional tariffs on nearly all goods imported into the United States, varying rates based on the country of origin. Here are some key details from the tariff plan:
- Universal Basic Duty: A 10% tariff will be applied to all imports into the U.S.
“Worst Offenders”: Approximately 60 countries accused of unfair trade practices will face significantly higher tariffs starting April 9. These include:
- China: 34% tariff, added to the existing 20%, for 54%.
- Vietnam: 46% tariff.
- Thailand: 36% tariff.
- Japan: 24% tariff.
- European Union countries: 20% tariff.
The following section will discuss how misleading this classification can be.
Automobile Tariffs: A special 25% tariff will be imposed on all foreign cars and their components, significantly impacting foreign car manufacturers.
President Trump did not hold back in his trade offensive; countries from Europe to China, Japan to Brazil, are all set to “pay the price.” This list includes microstates and remote territories, ranging from the Svalbard Islands in the Arctic Circle to the uninhabited Heard and McDonald Islands, home only to penguins.
“We have been robbed for more than 50 years, but that won’t happen again,” thundered Trump, asserting that jobs and factories will return to the U.S. thanks to the tariffs. He even invited foreign companies: ‘If you want zero tariffs, come produce in America.’ In summary, this is America First version 2.0, which this time criticises virtually anyone living beyond the borders, even penguins.
How are duties calculated? The confusion between duties and VAT
As you may have noticed from the quotes, Donald Trump’s narrative has consistently centred on reciprocal tariffs. The former president has referred to his tariffs as “reciprocal tariffs,” claiming that the United States will impose duties only equivalent to the tariffs other countries have on American products. On the surface, this reasoning seems almost reasonable; however, the calculation method used by the White House is flawed.
In practice, Washington classified any existing foreign levy to justify high tariffs, confusing value-added tax (VAT) with actual duties. For instance, regarding Europe, Donald Trump claimed, “The EU is charging us 39%!” However, this figure is derived from Europe’s actual duties on some American products (less than 3%) and the VAT. This consumption tax varies from country to country. This calculation also includes any environmental or technical regulatory taxes, leading to a misleading representation of the actual tariff burden.
In simpler terms, the U.S. administration interpreted every existing tax on European products as punitive tariffs against the U.S.. It used basic mathematical operations to calculate the duties we see today.
No serious economist would equate the Added Tax (VAT), which all consumers pay, including Europeans, with a duty specifically targeting foreign goods. However, this is how it is perceived to work in the “alternative reality” of the Trump trade war.
Reverse engineering on the trade deficit
The second part of the creative process by which the Trump administration determined the duties to impose on other countries is quite intriguing. The primary focus here is the trade deficit. Trump has consistently viewed this deficit as a scorecard: if the US imports more from one country than it exports, he interprets it as ‘losing’ and believes the other country is cheating.
For instance, it is well known that the US has a trade deficit of around $2.5 billion with Russia (importing more from Moscow than it exports). Trump frequently highlighted this fact in the past to justify implementing punitive measures.
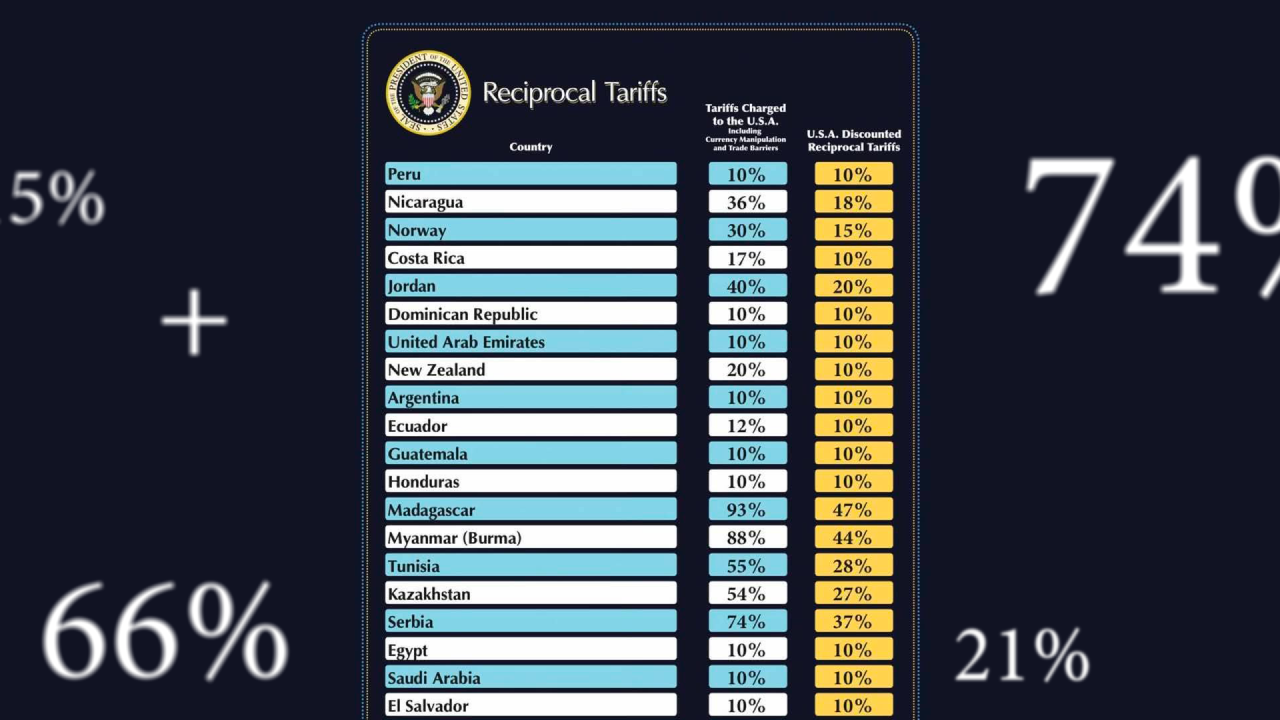
During his narrative, the president mistakenly conflated the trade deficit with subsidies and integrated it into the formula discussed earlier. The result? The duties announced by the Trump administration are simply derived from the trade deficit divided by the respective country’s total exports to the United States.
Let’s illustrate this with a practical example by calculating the duty applied to Indonesia. The United States has a trade deficit of $17 billion with Indonesia, while Indonesian exports to the US amount to $28 billion.
Calculating it:
17 / 28 = 0.64 → 64%, precisely the figure on Donald Trump’s chart.
This aligns with the government’s Reciprocal Tariff Calculations page: you take the US trade deficit in goods with a specific country, divide it by the total imports of goods from that country, and then divide the result by two. A trade deficit occurs when a country imports more physical goods from other countries than it exports to them.
The possible impact of these decisions
We have already observed the impact of the tariffs imposed by Donald Trump, at least on the surface. During the first day following the announcement, the US stock market plummeted approximately 8% (S&P 500), while the NASDAQ dropped about 9% since the beginning of the week.
On the other hand, Bitcoin has held up slightly better. Although it is currently down about 7%, it remains in a favourable position compared to last week.
From a geopolitical perspective, the situation appears even more critical. It is difficult to understand the rationale behind the decisions made by the US president. Trump seems to be aiming to dismantle globalisation, which is the process that has gradually removed barriers to free trade and facilitated economic integration between countries.
There’s an interesting paradox: for many countries, selling goods abroad at higher prices has been a means to accelerate capital accumulation and move closer economically to wealthier nations. This is how China experienced rapid growth, and Europe has also benefited somewhat from this process. However, the real winner of globalisation has been the United States. Why is that?
The U.S. gained favour with half the world by defeating the Soviet system, which failed to provide both consumption and growth. The United States initiated this process by reducing tariffs and showcasing the strength of its market economy. Free trade allowed the U.S. to emerge as a cultural, technological, and economic superpower, contributing to the decline of both the Soviet Union and Maoist China. This approach has generated significant wealth.
Contrary to what Trump might suggest, global trade does not harm the United States today. Thanks to its technological advantages, the US has focused on sectors that yield high productivity and added value. The outcome is a wealthier nation that produces fewer low-cost goods (which it imports) while buying these products at a low price, thus maintaining a very high per capita income.
This success is primarily due to American dominance in the services sector. Consider how many digital services we use daily—such as social media, search engines, streaming platforms, and software—are designed, operated, and monetised in the United States.