Do you know about the most important bearish phases in history? What does the crypto bear market of 2022 have in common with past ones?
Following Confucius’ maxim ‘study the past if you want to predict the future’, we are here to analyse past bearish phases with the aim of understanding the dynamics of the bear market we are experiencing now.
If you too are wondering: how long will the 2022 crypto bear market last? Will the price of Bitcoin collapse again? Unfortunately there are no certain answers. However, in this article, you can find information that can help you look at the current state of the market in perspective. For example, we can look at the duration of bearish phases, the elements involved or understand what caused them.
1. The American stock market crash of 1929
The New York Stock Exchange crash of 1929 is the first major crash of a contemporary financial market and the first major crisis caused by free markets and financial speculation. Before the crash of ’29, The United States of America was experiencing one of the most prosperous and economically prosperous periods in history, the so-called ‘Roaring Twenties’. The great economic prosperity of the States seemed unstoppable, made possible by victory in World War I as well as liberal economic policies. However, this economic growth suddenly came to a halt, due to the progressive saturation of the market. Factories closed, products remained unsold and companies began to lay off employees. The crisis of the real economy was reflected on the New York stock exchange through the collapse of the stocks held by both the big capitalists of the time as well as the middle class and small bourgeoisie, who suddenly found themselves without savings.
The real crash came on Thursday 24th October, the infamous Black Thursday. That moment started an intense bear market, nicknamed in retrospect: ‘The Great Depression’. The Great Depression triggered a recession that resulted in a 60% drop in world trade and generated 15 million unemployed people. The Dow Jones, the main US stock index, collapsed by 75% of its value in a few months.
2. The ‘dotcom’ bubble
One of the bear markets in history worth mentioning is the one following the ‘dotcom bubble’. The term ‘dotcom bubble‘ is used to describe the phenomenon of unprecedented growth in the share valuations of technology companies, known as ‘dotcoms’, which occurred in the late 1990s. This juncture was characterised by an exponential growth of investments in internet start-ups. It all started with Netscape, the first Internet browser start-up, whose price per share jumped from $28 to $147 in five months. This strong bullish movement brought incredible enthusiasm to the markets, and in particular to the ‘dotcoms’. Alongside Netscape, Yahoo, Amazon and Apple, hundreds of other fledgling companies exploded on the stock exchange.
However, the bubble burst in April 2000, shortly after the all time high (ATH) of the NASDAQ, the stock market index that tracks the prices of the major American technology companies, at 5,048 points. The bubble burst because, in most cases, the dotcoms had no intrinsic value or viable product but were nothing more than aggressive marketing campaigns. This bear market lasted about two years, during which time the NASDAQ index hit 1,111 points, losing more than 75% of its value.
3. The 2008 subprime crisis
The 2008 bear market can be included in the list of major bear markets in history. The economic crisis of 2008 is the one that has most affected our most recent past. Once again, it was the US that started this recession, with the subprime mortgage crisis that erupted at the end of 2006. Subprime mortgages were financial loans granted by major US banks and financial giants, including Chase, JP Morgan and Lehman Brothers to high risk defaulters, i.e. bad debtors. The crisis exploded in September 2008, when the insolvency situation generated by subprime mortgages was combined with a bubble in the housing market. This bubble was the result of accommodative policies by the Federal Reserve (FED), the central bank of the United States.
The bear market of 2008 did not remain confined to the States but obviously extended to Europe as well. The central banks of the countries found themselves forced to inject huge amounts of money into their economies, through monetary policies of Quantitative Easing, in an attempt to stem the collapse of the global economy. During the 2008 bear market, the S&P 500 (Standard and Poors) stock market index, which tracks the performance of the 500 most capitalised US companies, plummeted 38.5% and the US financial giant Lehman Brothers declared bankruptcy. The bear market of 2008 had a much bigger impact than can be guessed from the charts. The effects of the systemic crisis generated by the bursting of the subprime bubble are still being felt today.
4. The first crypto bear market: the Mt. Gox hack in 2014
The first real crypto bear market arrived in 2014. Sure, Bitcoin existed since 2008, but until 2013, it had no real market. The only way to buy it was through peer-to-peer exchanges, and its use was relegated to Dark Web sites like Silk Road. However, from 2013 onwards, the buying and selling of BTC was building a real market, mainly due to the growth of the then largest crypto exchange in the world, MT Gox. It was responsible for processing the majority of Bitcoin transactions worldwide.
This period was characterised by the emergence of many exchanges and wallets and is nicknamed the ‘Hack Era’. Between March 2012 and October 2013, numerous exchanges including Linode, Biconica and Bit floor were hacked. The first hacks did not affect the price of Bitcoin, which continued to rise undaunted. From $5 in March 2012, the price of BTC reached $1,150 in November 2013.
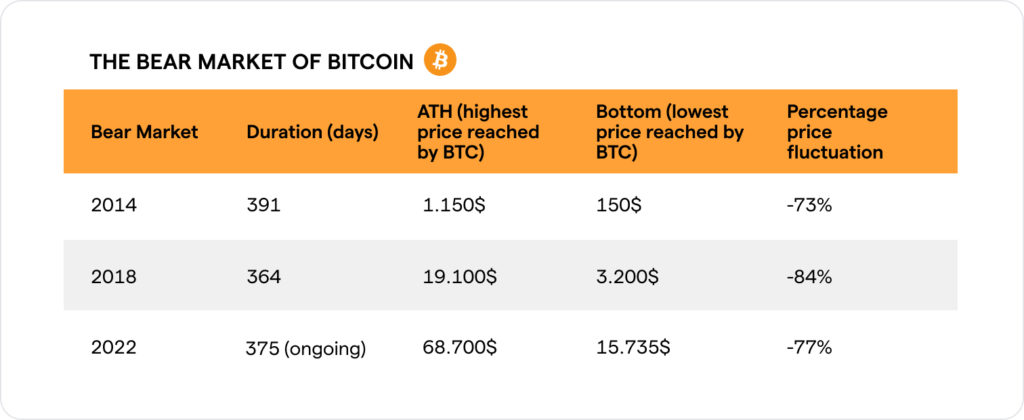
At this point, however, came the first black swan event in crypto history happened: the Mt. Gox hack, through which 850,000 Bitcoins were stolen. This black swan event kicked off the first real crypto bear market that lasted 391 days. From a price of $1,150 BTC reached $150, losing 73% of its value.
5. Bear market 2018: ICOs
The spirit of the crypto market cycle from 2016 to 2019 can be summed up in one acronym: ICOs. The term is an acronym for Initial Coin Offering, and it is the equivalent of initial public offerings in the cryptocurrency world. They are pre-sales of tokens that allow those who participate in them to financially support a crypto project before it is launched, through the purchase of native crypto.
This way of selling to the public was popularised by Ethereum in July 2014. ICOs have been simultaneously the curse and delight of this crypto cycle. On the one hand, they allowed the Web3 world to grow and many projects to find supporters. On the other hand, they generated a major speculative bubble, comparable in the way it inflated to the dotcom bubble. The proliferation of ICOs and the great enthusiasm for this new market allowed for many fraudulent projects to raise huge amounts of money. Due to the global macroeconomic situation, in particular the restrictive monetary policies including Quantitative Tightening, the ICO bubble burst at the end of 2017. This caused the beginning of the bear market. Quantitative Tightening is an abrupt tightening of a state’s monetary policy that results in an increase in interest rates with the aim of limiting inflation.
Bitcoin’s price collapsed from the $19,100 ATH to the $3,200 level, losing 84% of its value. Ethereum fared even worse, as the value of Vitalik Buterin‘s crypto went from $1,400 to around $150, registering a downward movement of -95%. The bottom, i.e. the lowest point reached by a crypto in this cycle, was reached exactly one year after the ATH was reached, on the 17th of December 2018.
6. The crypto bear market of 2022
The particularities of this market cycle are the influence of the COVID-19 pandemic, an event of global magnitude that affected the economy and society, and the entry of institutional investors into the market.
The latter increased speculation, a double-edged sword for all kinds of markets. On the one hand it generates rapid growth, on the other it creates the conditions for an equally rapid descent. This collapse actually occurred on the 12th of May 2021, the day when the price of Bitcoin dropped from around $60,000 to $30,000 in just a few hours. However, this collapse did not signal the start of a bear market as it was reabsorbed in the following months, allowing Bitcoin to reach another high in November 2021. The crypto bear market of 2022 began in the spring, the first catalyst for this bearish phase being the Terra-Luna ecosystem collapse of May 2022. As the months went by, events such as the FED raising interest rates and the failure of the centralised exchange FTX a few weeks ago further fuelled this bear market.
The biggest news in the latest phase of the crypto market, which runs from 2020 to today, concerns adoption. In past bear markets, so-called mass adoption, which was resolved in the number of traditional companies adopting Web3 technologies and the number of users using them, came to an almost complete standstill. The cycle we are currently experiencing seems different. Adoption is continuing despite the conditions of this bear market. An example of this trend is Polygon‘s blockchain, which signed important partnerships with companies outside the world of crypto.
The price differences between the 2018 and 2022 bear markets
So, what are the main differences between this bear market and that of 2018? Let’s look at it from the perspective of the price of the two highest market cap cryptos: Bitcoin and Ethereum. We can start by looking at the price level from which the two bear markets started: in 2018, Bitcoin’s price at ATH was $19,100 while Ethereum’s was around $1,400.

The bearish movement from the highest point reached by the price of Bitcoin to its lowest point in 2018-2019 lasted 364 days, causing BTC and ETH to capitulate at $3,200 and $150, respectively. The price swing was -84% in the case of Bitcoin and -95% in the case of Ethereum.
In the 2022 bear market crypto, the bottom for Bitcoin is for now, is around $15,500. It was reached on the 21st of November 2022, 375 days after the ATH was reached. For the price of Ethereum the situation is somewhat different. The ATH was reached on the 15th of November 2021 but the bottom is located, for now, at around $880, which was reached in July 2022.
Now that you have some information at your disposal, how much longer do you think the 2022 crypto bear market will last? Could the bearish phase have ended a few days ago with the drop to $15,735?


